개·고양이 얼굴 탐지: SSDLite320과 YOLOv8n을 같은 조건에서 비교하기Cat and Dog Face Detection: Comparing SSDLite320 and YOLOv8n Under the Same Conditions
같은 Oxford-IIIT Pet 얼굴 박스 데이터에서 SSDLite320과 YOLOv8n 중 어떤 모델이 얼굴을 더 정확하고 빠르게 찾는가?
품종 37개를 맞히는 분류 문제가 아니라, 사진 속 동물의 얼굴(head ROI) 위치를 cat_face, dog_face 두 클래스로 찾는 객체 탐지 문제다. 두 경량 탐지 모델을 비교하면서 “정말 같은 조건에서 비교하고 있는가?”를 계속 확인했고, 그 과정에서 비교 실험을 한 번 다시 설계했다.
한 줄 요약
- 학습 조건(optimizer, 학습률 후보, EMA, 후처리)을 SSDLite320에 맞춘 YOLOv8n이 holdout mAP@0.5:0.95 0.7533 → 0.8401(시드 3개 평균)로 더 정확했다.
- mAP@0.5는 두 모델 모두 0.99 근처로 비슷했다. 차이는 높은 IoU 기준의 박스 정밀도에서 났다.
- 추론도 YOLOv8n이 빨랐다. 이 Mac 기준 중앙값으로 MPS 11.5 → 7.2 ms, CPU 108.1 → 11.0 ms였다.
데이터셋
| 항목 | 내용 |
|---|---|
| 출처 | Oxford-IIIT Pet Dataset (Parkhi et al., CVPR 2012) |
| 이미지 | 7,390장 (고양이 12종, 개 25종, 총 37품종) |
| 정답 | PASCAL VOC 형식 XML의 얼굴 박스 3,686개 파일 |
| 클래스 | 0 = cat_face, 1 = dog_face |
| 공식 분할 | trainval 3,680장, test 3,669장 |
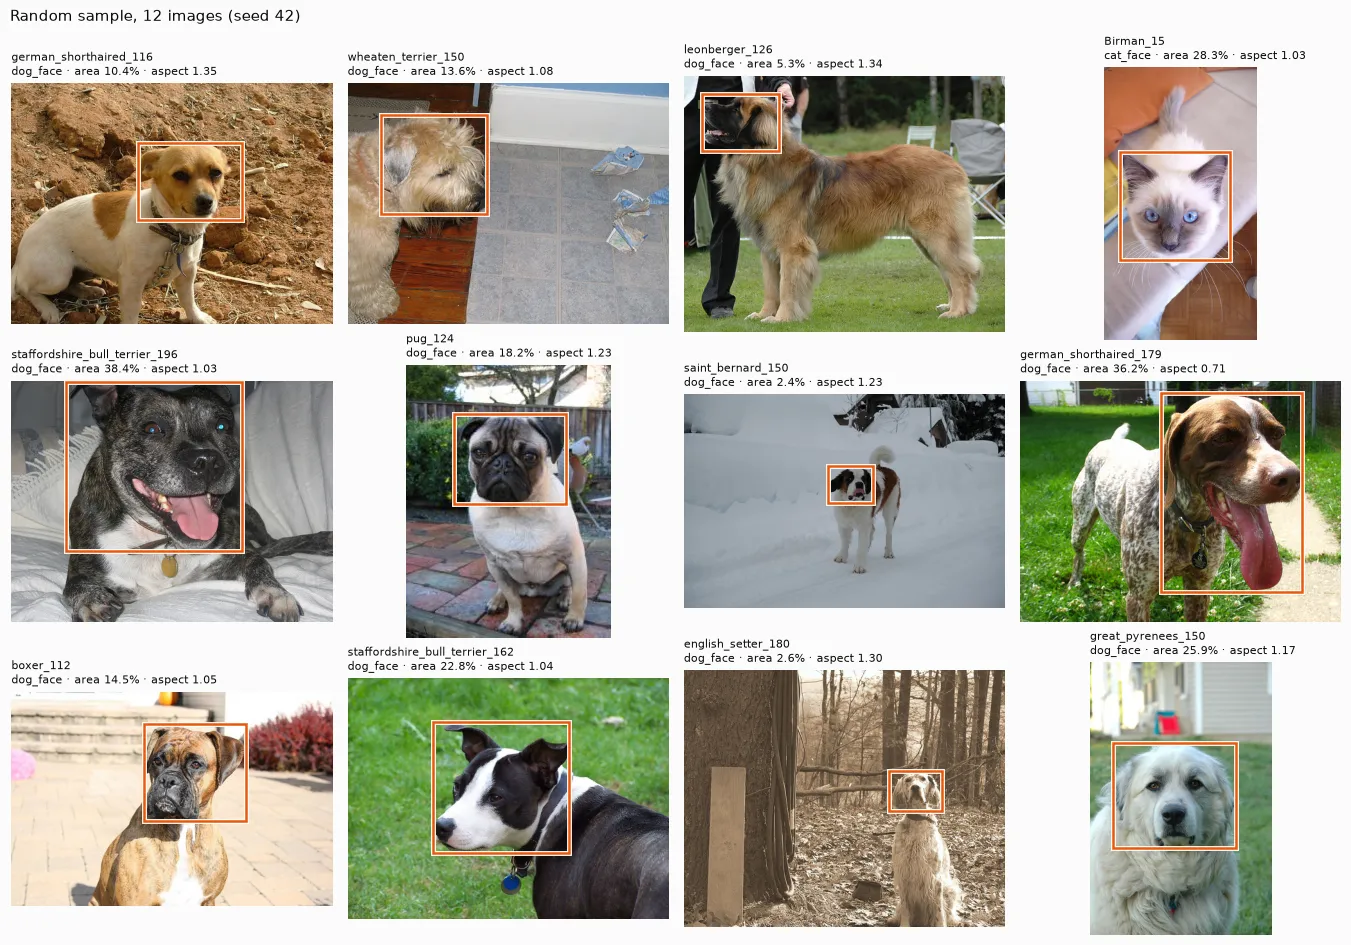
train·validation에서 무작위로 뽑은 12장. 주황 박스가 XML 정답이다. 얼굴 크기와 위치, 배경이 다양하다.
여기서 첫 번째 문제가 나온다. 공식 test에는 얼굴 정답 XML이 하나도 없다. 그래서 test로는 AP를 계산할 수 없고, 정답이 있는 trainval을 train/validation/holdout으로 다시 나눠야 했다.
데이터 확인: 학습 전에 무엇을 믿을 수 있는가
README와 실제 파일 대조
README 설명 중 대부분은 실제 파일과 맞았다. 다만 그대로 믿으면 안 되는 부분이 세 가지 있었다.
| README 설명 | 실제 데이터 | 판단 |
|---|---|---|
| BREED ID: 고양이 1~25, 개 1~12 | list.txt에서는 고양이 1~12, 개 1~25 | README 오기로 보고 list.txt 값을 기준으로 삼음 |
list.txt는 전체 이미지 목록 | 이미지 7,390장 중 list.txt에는 7,349장 | 목록 밖 41장 존재 |
| 모든 이미지에 head ROI 정답 | XML은 3,686개뿐, 공식 test는 0개 | test는 AP 평가에 쓰지 않음 |
파일 대응과 이미지 품질
| 점검 | 결과 |
|---|---|
trainval 중 이미지+XML이 모두 있는 것 | 3,671장 (XML 없는 9장) |
| 목록 밖 이미지 | 41장 (그중 15장은 XML 있음) |
| 파일명·XML 불일치, 파싱 실패, 분할 간 중복 ID, 메타데이터 충돌 | 모두 0건 |
| 디코딩 실패 | 0 / 7,390 |
확장자는 .jpg인데 실제 형식이 다른 파일 | 10장 (GIF 6, PNG 4) — 모두 XML 없음 |
| 학습 후보 3,671장의 형식 | 전부 RGB JPEG, XML 크기와 실제 크기 전부 일치 |
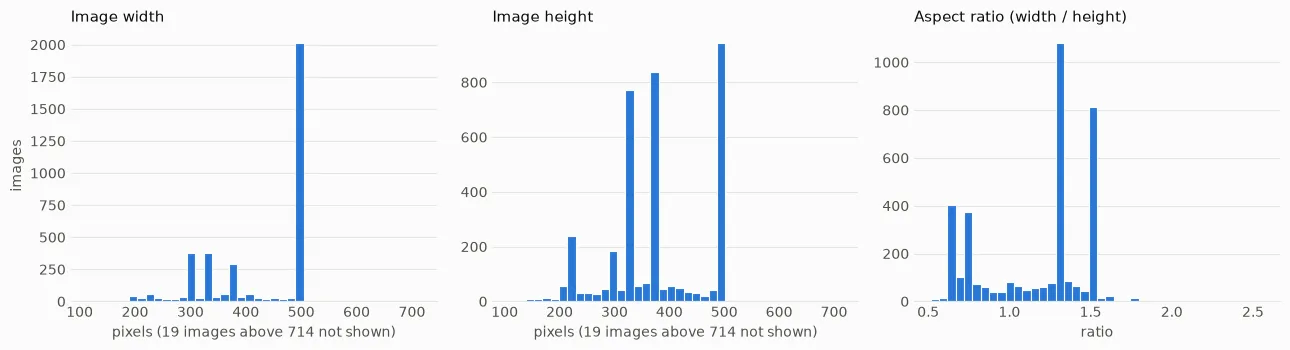
학습 후보 이미지의 너비·높이·종횡비 분포. 대부분 500×375 근처(종횡비 중앙값 1.33)에 몰려 있지만, 짧은 변은 108~2,448px, 종횡비는 0.52~2.56까지 퍼져 있다. 이 꼬리 때문에 320×320으로 줄일 때 얼굴 모양이 얼마나 바뀌는지 따로 확인해야 했다.
박스 좌표
XML 3,686개에서 박스 3,687개가 나왔다. 좌표 형식 오류, 크기 0 이하, 이미지 밖 좌표, 알 수 없는 클래스, 공식 종 정보와의 충돌은 모두 0건이었다. 박스가 2개인 이미지는 Bengal_105 한 장(고양이 두 마리)이라, 데이터셋과 평가기는 이미지당 여러 박스를 받도록 만들었다.
좌표 최솟값이 0이 아니라 1이고, xmax가 이미지 너비와 같은 박스도 있었다. PASCAL VOC식 “1부터 세고 끝점 포함” 좌표로 보고, 모델에 넣을 때는 xmin-1, ymin-1, xmax, ymax 연속 좌표로 바꿨다.
좌표 규칙을 통과해도 박스가 실제로 얼굴을 덮는지는 따로 확인했다. 무작위 12장, 상대 면적이 가장 작은·큰 박스 각 8개, 종횡비 극단 6개, 박스 2개 이미지까지 서로 다른 34장을 눈으로 봤다.
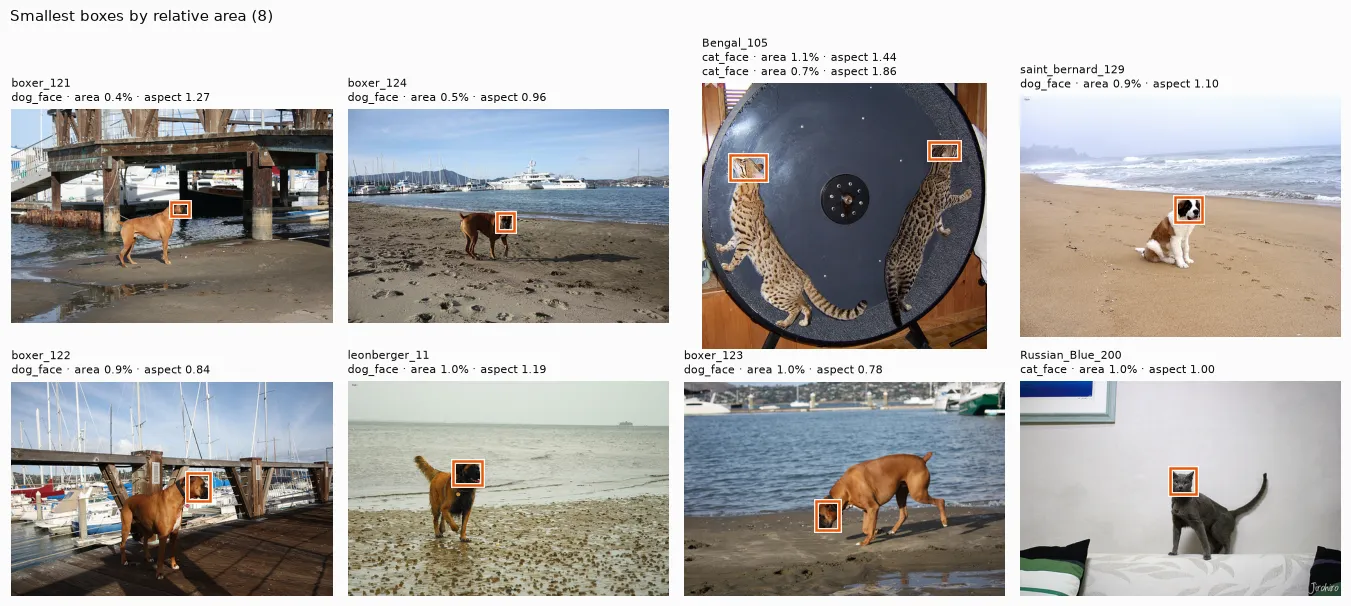
상대 면적이 가장 작은 박스 8개(이미지의 0.4~1.0%). 작은 박스도 멀리 있는 동물의 얼굴을 정확히 가리키고 있었다. 종횡비 극단 중 beagle_181 한 장만 박스가 몸통 일부까지 넓게 잡혀 있었는데, 한 사례만으로 정답을 고치지는 않았다.
중복 이미지와 분할
MD5 해시로 바이트가 완전히 같은 파일을 찾았다. 7,390장 중 고유 해시는 7,360개, 같은 해시 묶음은 29개(59장)였다.
- 후보끼리 같은 묶음에 2장 이상 들어간 경우: 0
- 후보와 공식 test가 같은 묶음인 경우: 0
- 목록 밖 41장 중 30장은 목록 안 이미지의 복사본이었다.
그래서 목록 밖 41장은 분할에서 제외했다. 공식 종·품종 근거가 없고, 복사본이 분할 경계를 넘으면 평가가 낙관적으로 나올 수 있기 때문이다.
남은 후보 3,671장을 품종별 비율을 유지하며 70:15:15로 나눴다(분할 시드 42).
| 분할 | 이미지 | 박스 | 고양이 비율 | 용도 |
|---|---|---|---|---|
| train | 2,567 | 2,568 | 0.321 | 학습 |
| validation | 554 | 554 | 0.323 | 학습률·best epoch·모델 선택 |
| holdout | 550 | 550 | 0.322 | 설정 확정 후 마지막 1회 평가 |
분할 간 공유 image_id와 MD5는 0개였다. holdout은 이후 전처리 결정, 박스 시각 점검, 튜닝 어디에도 쓰지 않았다.
전처리: 레터박스냐, 그냥 늘리냐
두 모델 입력을 320×320으로 통일해야 했다. 후보는 두 가지였다.
| 방식 | 박스 짧은 변 중앙값 | 짧은 변 < 16px | 얼굴 모양 |
|---|---|---|---|
| 레터박스 (비율 유지 + 패딩) | 99.8px | 0% | 유지, 대신 캔버스의 평균 26.4%가 패딩 |
| 직접 리사이즈 (stretch) | 108.2px | 0% | 이미지 종횡비만큼 왜곡 (5~95% 구간 0.67~1.51, 최대 2.56) |
얼굴 크기 면에서는 두 방식 차이가 작았다. 그래서 얼굴 모양을 보존하는 쪽을 택해 레터박스로 정했다.
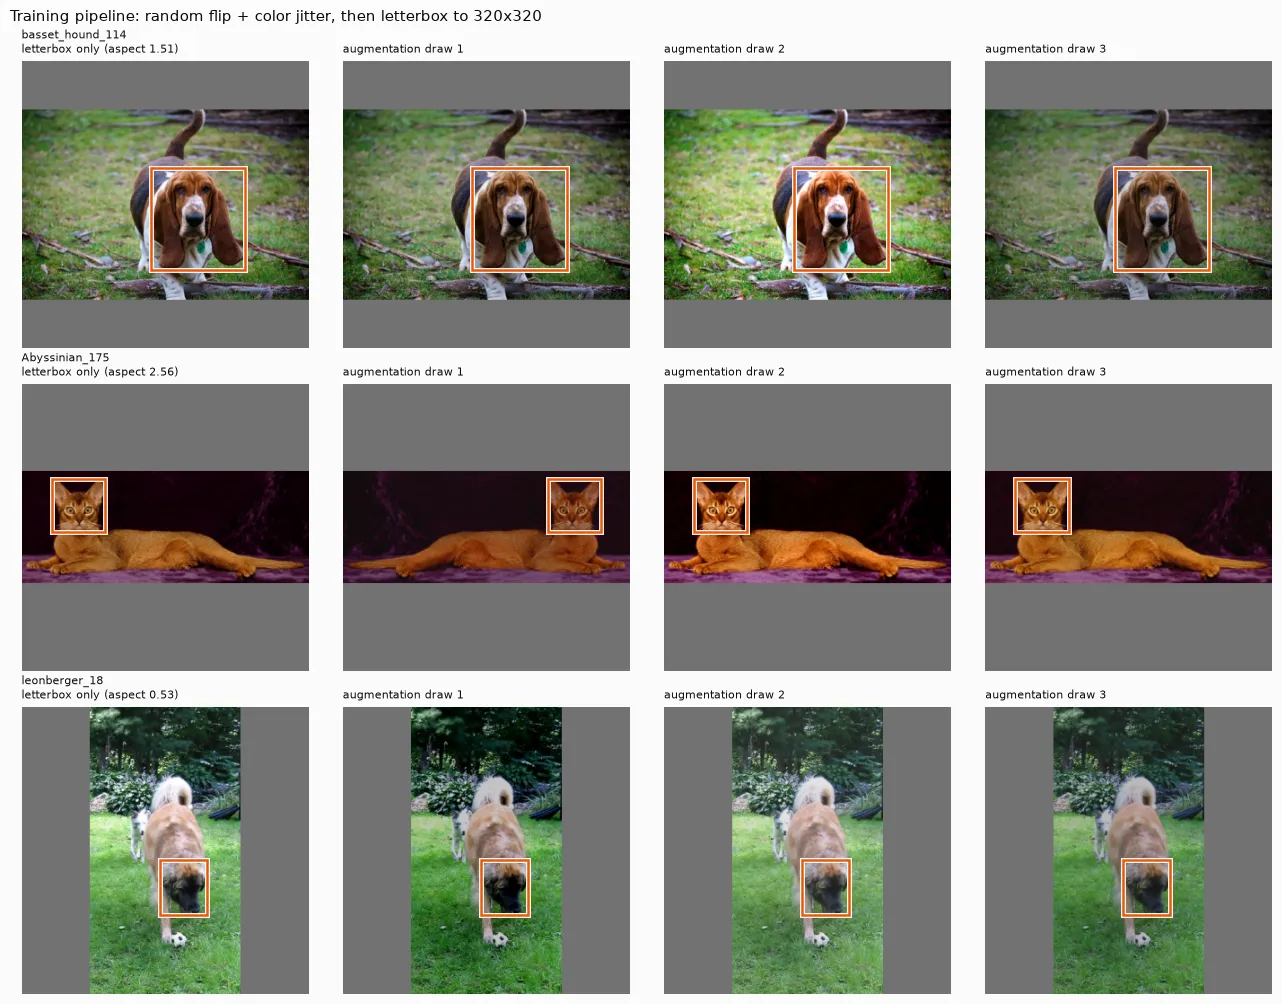
왼쪽 열은 레터박스만 적용한 입력, 오른쪽 세 열은 증강을 더한 예시. 종횡비 2.56(가운데 줄)이나 0.53(아래 줄)인 이미지도 얼굴이 찌그러지지 않고, 패딩만 늘어난다.
| 증강 설정 (train에만 적용) | 값 |
|---|---|
| 좌우 반전 | 확률 0.5 |
| 밝기·대비·채도 | ±0.3 |
| 색조 | ±0.02 |
| 패딩 색 | 114 (증강을 레터박스 전에 적용해 패딩 색이 변하지 않게 함) |
| 제외한 것 | 확대·축소·이동·크롭, YOLO Mosaic |
Mosaic처럼 한 모델에만 익숙한 증강을 빼서, 두 모델이 같은 입력을 보게 했다.
학습 전에: 평가기와 학습 경로부터 검증
두 모델의 내장 평가 함수는 서로 정의가 조금씩 다르다. 그래서 공통 평가기를 따로 만들고 두 모델 모두 이 평가기로 채점했다.
| 평가 설정 | 값 |
|---|---|
| 주 지표 | mAP@0.5:0.95 (보조: mAP@0.5, 클래스별 AP) |
| IoU 임계값 | 0.50~0.95, 0.05 간격 10개 |
| 정밀도 보간 | COCO 방식 101점 |
| 최대 검출 수 | 이미지·클래스당 100 |
| 점수 필터 | 없음 (정량 평가 시) |
평가기는 손으로 계산 가능한 사례(완벽한 예측, 예측 없음, IoU 0.667, 클래스 오류, 중복 예측 등)를 포함한 30개 점검을 통과했다. 별도 환경에서 pycocotools와 무작위 시나리오 4개로 대조했을 때 mAP 차이는 6e-17 이하였다.
실제 학습 전에는 학습 이미지 16장만 증강 없이 반복 학습해, 모델이 그 16장을 외울 수 있는지 봤다.
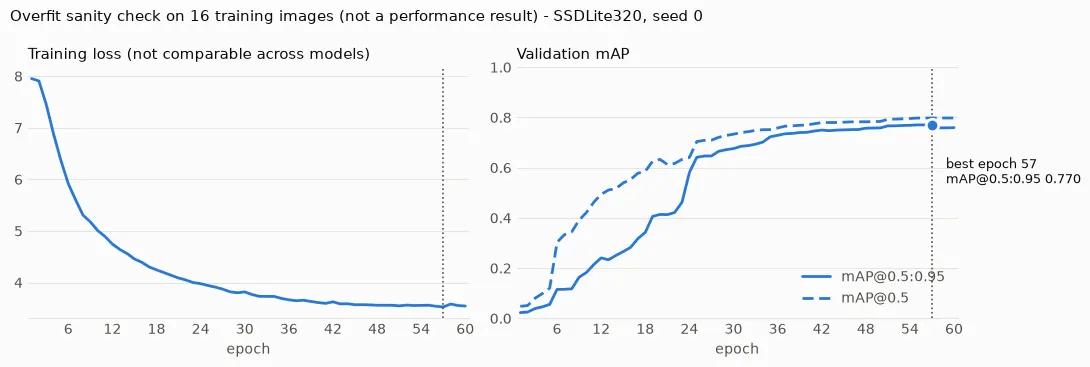
SSDLite320 과적합 점검. 60 epoch 동안 손실은 7.95 → 3.54로 줄고, 같은 16장의 mAP@0.5:0.95는 0.023 → 0.759로 올랐다. 일반화 성능이 아니라 로딩 → 좌표 변환 → 손실 → 예측 → 좌표 복원 → 평가가 끝까지 연결됐다는 증거로만 쓴다. YOLOv8n도 같은 점검에서 0.176 → 1.000까지 올랐다.
이 밖에 조기 종료와 best epoch 복원, NaN 손실 시 중단, 중간에 끊었다가 이어서 학습해도 결과가 같은지까지 확인한 뒤 본 학습에 들어갔다.
실험 설계: 결과를 보기 전에 예산을 고정
두 모델 모두 같은 규칙을 썼다.
| 항목 | 값 |
|---|---|
| 사전학습 | COCO (분류 헤드만 2클래스로 새로 초기화) |
| 배치 / 최대 epoch | 16 / 30 |
| 조기 종료 | validation mAP@0.5:0.95가 5 epoch 동안 오르지 않으면 종료 |
| 학습률 스케줄 | 100회 선형 워밍업 후 코사인 감소 |
| 실험 예산 | 학습률 후보 3개 × 시드 0 → 선정한 학습률로 시드 1·2 추가 (모델당 5회) |
| 선정 기준 | validation mAP@0.5:0.95의 best epoch 값 |
결과를 본 뒤 후보를 늘리지 않도록 예산을 미리 정했다. 최종 숫자는 가장 좋은 시드 하나가 아니라 시드 3개 평균 ± 표본 표준편차로 보고한다.
실험 1: SSDLite320
SGD(모멘텀 0.9, weight decay 4e-5)로 학습률 1e-3, 3e-4, 1e-4를 탐색했다.
중간에 데이터·분할·annotation 해시를 실행 ID에 넣는 재현성 가드를 추가했다. 그 전에 돌린 SSDLite320 결과는 예비 기록으로 남기고, 아래 수치는 수정된 코드로 다시 학습한 결과다.
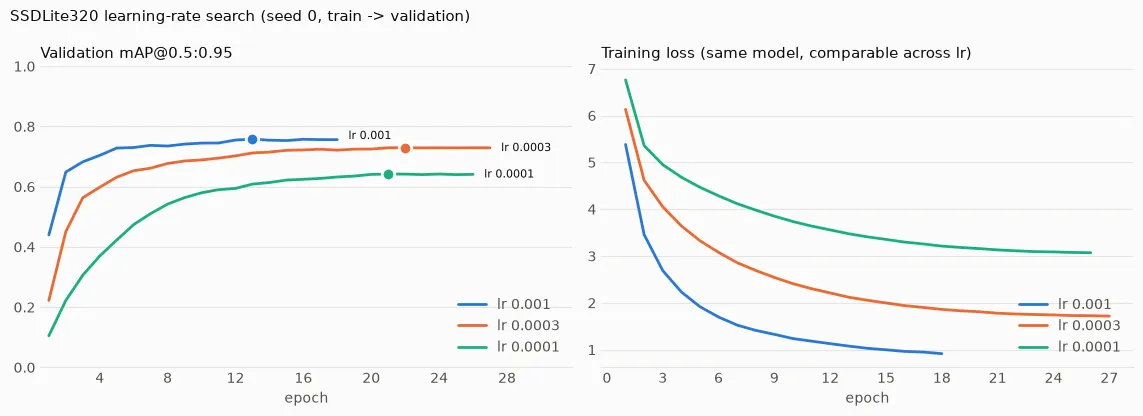
왼쪽: validation mAP@0.5:0.95, 오른쪽: 학습 손실(같은 모델이라 학습률끼리 비교 가능). 학습률이 낮을수록 손실이 높은 곳에서 멈췄다. 30 epoch 예산 안에서는 덜 학습된 것으로 보인다.
| 학습률 | best / 종료 epoch | mAP@0.5:0.95 | mAP@0.5 | 마지막 학습 손실 |
|---|---|---|---|---|
| 1e-3 | 13 / 18 | 0.7580 | 0.9757 | 0.92 |
| 3e-4 | 22 / 27 | 0.7293 | 0.9644 | 1.72 |
| 1e-4 | 21 / 26 | 0.6420 | 0.9078 | 3.07 |
1e-3을 골라 시드 1·2를 추가했고, 세 시드 모두 조기 종료했다.
| 시드 | 0 | 1 | 2 | 평균 ± 표준편차 |
|---|---|---|---|---|
| mAP@0.5:0.95 | 0.7580 | 0.7655 | 0.7605 | 0.7613 ± 0.0038 |
실험 2: YOLOv8n 기본 방식 — 공정한 비교인가?
처음에는 YOLOv8n을 Ultralytics 기본 학습 방식에 가깝게 돌렸다. AdamW, EMA, 기울기 자르기, NMS IoU 0.7이고 학습률 후보는 2e-3, 8e-4, 3e-4였다.
| 학습률 | best / 종료 epoch | mAP@0.5:0.95 |
|---|---|---|
| 2e-3 | 30 / 30 | 0.8014 |
| 8e-4 | 30 / 30 | 0.8377 |
| 3e-4 | 25 / 30 | 0.8534 |
3e-4로 시드를 반복하니 0.8511 ± 0.0025가 나왔다. SSDLite320보다 0.09 가까이 높다.
그런데 이 숫자를 그대로 비교할 수는 없었다. optimizer, EMA 유무, 후처리 NMS 기준, 학습률 범위가 모두 다르기 때문이다. 이대로라면 차이가 모델 구조에서 왔는지 학습 방식에서 왔는지 구분할 수 없다.
실험 3: 조건을 SSDLite320에 맞춘 YOLOv8n
그래서 YOLOv8n의 학습 방식을 SSDLite320 쪽에 최대한 맞춰 다시 학습했다.
| 항목 | SSDLite320 | YOLOv8n 기본 (참고) | YOLOv8n 공통 조건 |
|---|---|---|---|
| optimizer | SGD, 모멘텀 0.9, wd 4e-5 | AdamW, wd 5e-4 | SGD, 모멘텀 0.9, wd 4e-5 |
| 학습률 후보 | 1e-3, 3e-4, 1e-4 | 2e-3, 8e-4, 3e-4 | 1e-3, 3e-4, 1e-4 |
| EMA | 없음 | 있음 | 없음 |
| 기울기 자르기 | 없음 | 노름 10 | 없음 |
| 역전파 손실 | 이미지당 평균 | 배치 합 | 이미지당 평균 |
| 검증 NMS IoU | 0.55 | 0.7 | 0.55 |
| 데이터·증강·평가기·시드 | — | 같음 | 같음 |
손실 함수, 모델 구조, 새로 초기화되는 범위는 모델마다 다르므로 완전히 같은 조건은 아니다. 다만 바꿀 수 있는 학습 설정은 모두 맞췄다.
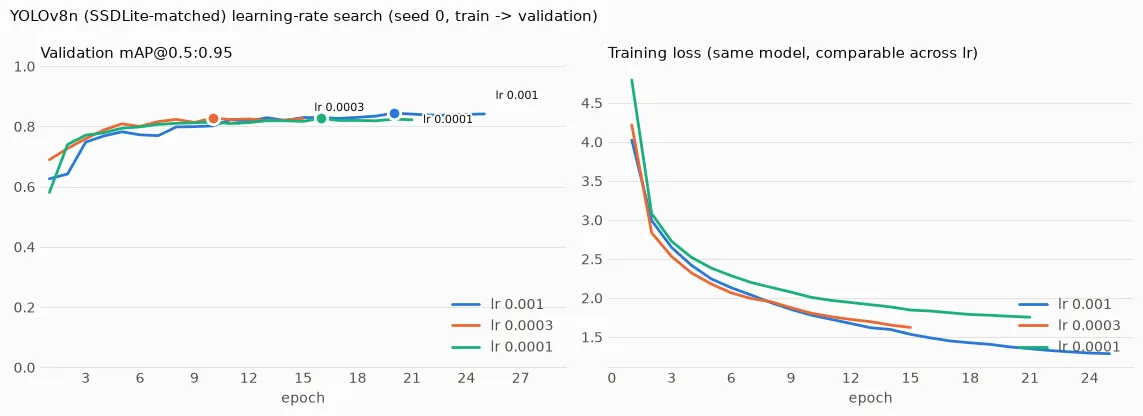
공통 조건 YOLOv8n의 학습률 탐색. SSDLite320은 학습률에 따라 best 점수가 0.64~0.76으로 벌어졌지만, YOLOv8n은 세 학습률이 0.827~0.844 안에 모여 있다. 같은 후보 범위에서 학습률에 덜 민감했다.
| 학습률 | best / 종료 epoch | mAP@0.5:0.95 | mAP@0.5 |
|---|---|---|---|
| 1e-3 | 20 / 25 | 0.8442 | 0.9916 |
| 3e-4 | 10 / 15 | 0.8281 | 0.9836 |
| 1e-4 | 16 / 21 | 0.8272 | 0.9800 |
| 시드 | 0 | 1 | 2 | 평균 ± 표준편차 |
|---|---|---|---|---|
| mAP@0.5:0.95 | 0.8442 | 0.8451 | 0.8306 | 0.8399 ± 0.0081 |
조건을 맞추자 YOLOv8n 점수는 기본 방식(0.8511)보다 0.0112 내려갔다. 그래도 SSDLite320보다는 여전히 크게 높다. optimizer, EMA, 학습률 범위가 함께 바뀌었으므로 이 0.0112가 어느 항목 때문인지는 분리하지 않았다.
validation 비교
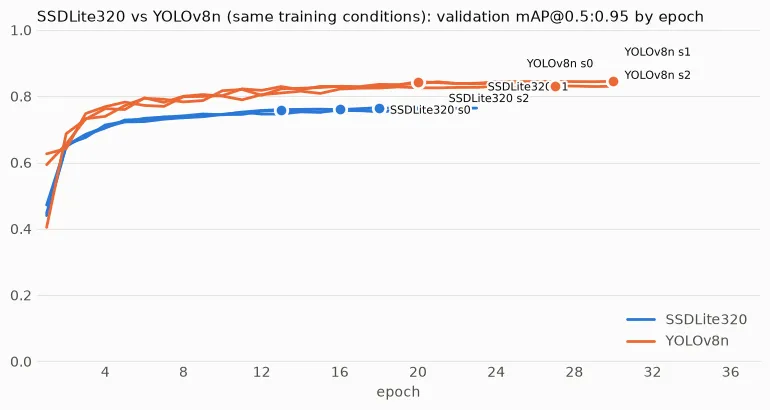
파랑 SSDLite320, 주황 YOLOv8n(공통 조건), 각 3시드. 첫 몇 epoch 이후 두 모델의 곡선은 겹치지 않는다. 시드 간 흔들림보다 모델 간 간격이 훨씬 크다.
| 모델 | mAP@0.5:0.95 | mAP@0.5 | epoch당 학습(s) | 파라미터(M) |
|---|---|---|---|---|
| SSDLite320 | 0.7613 ± 0.0038 | 0.9760 ± 0.0008 | 34 | 2.22 |
| YOLOv8n (공통 조건) | 0.8399 ± 0.0081 | 0.9890 ± 0.0023 | 24 | 3.01 |
- 평균 차이는 +0.0786이다.
- YOLOv8n의 가장 낮은 시드(0.8306)도 SSDLite320의 가장 높은 시드(0.7655)보다 높다.
- 그런데 mAP@0.5는 두 모델 모두 0.97~0.99로 비슷하다.
이게 이 실험에서 가장 중요한 단서였다. 얼굴이 대략 어디 있는지 찾는 능력은 둘 다 거의 포화 상태다. 차이는 IoU 0.75, 0.9처럼 박스를 얼마나 딱 맞게 그리느냐에서 벌어진다. 다만 박스 오차를 위치·크기별로 따로 분해하지는 않았다.
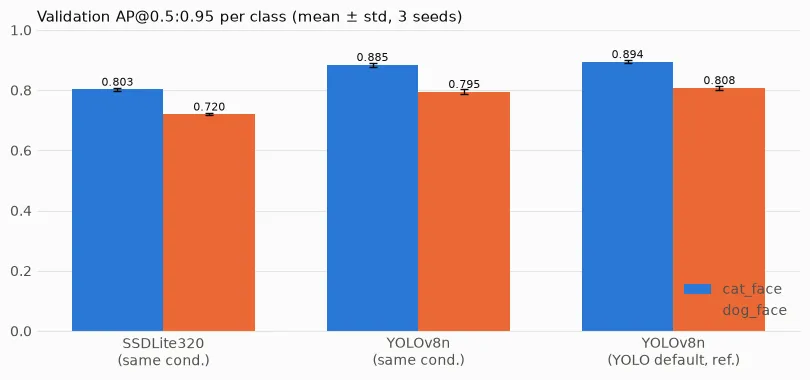
클래스별 AP@0.5:0.95 (3시드 평균 ± 표준편차). 두 모델 모두 고양이가 개보다 높다. SSDLite320은 0.803 vs 0.720, YOLOv8n은 0.885 vs 0.795다. 이 경향은 학습률·시드를 바꾼 모든 실행에서 같았다. 원인은 따로 실험하지 않았다.
같은 validation 이미지 8장에 두 모델의 예측을 그려 보면 차이가 눈에 들어온다(시각화용으로 점수 0.5 이상만 표시).
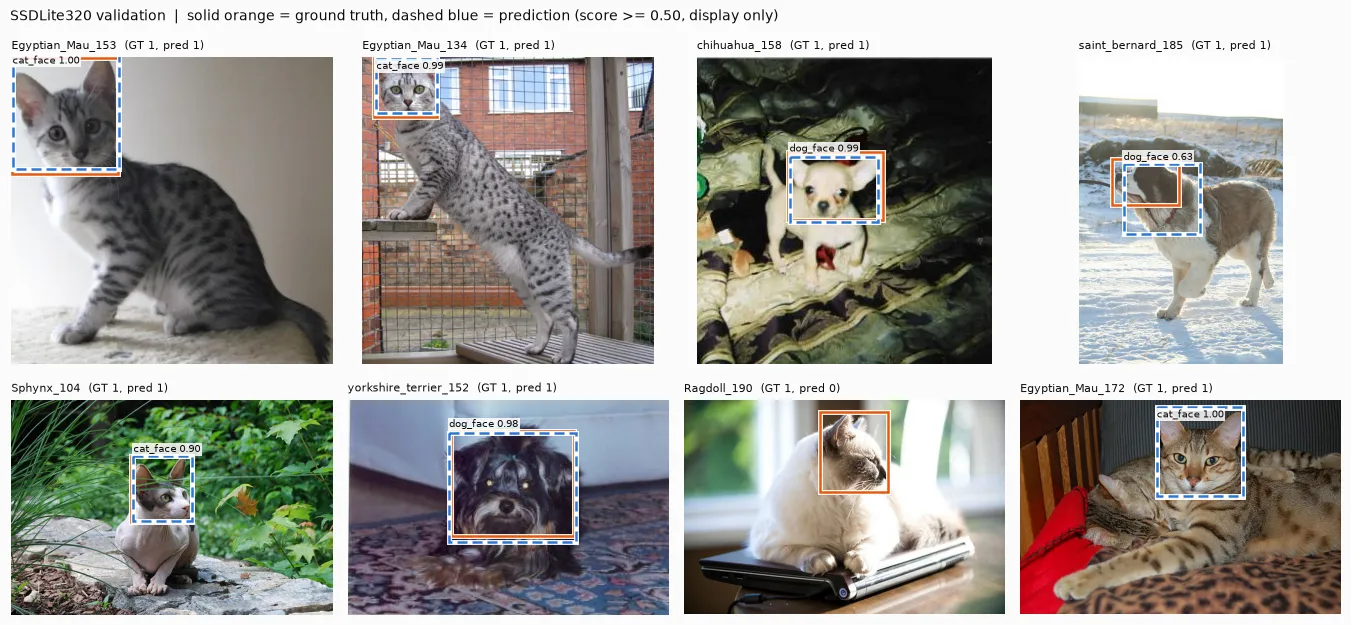
SSDLite320. 실선 주황이 정답, 점선 파랑이 예측이다.
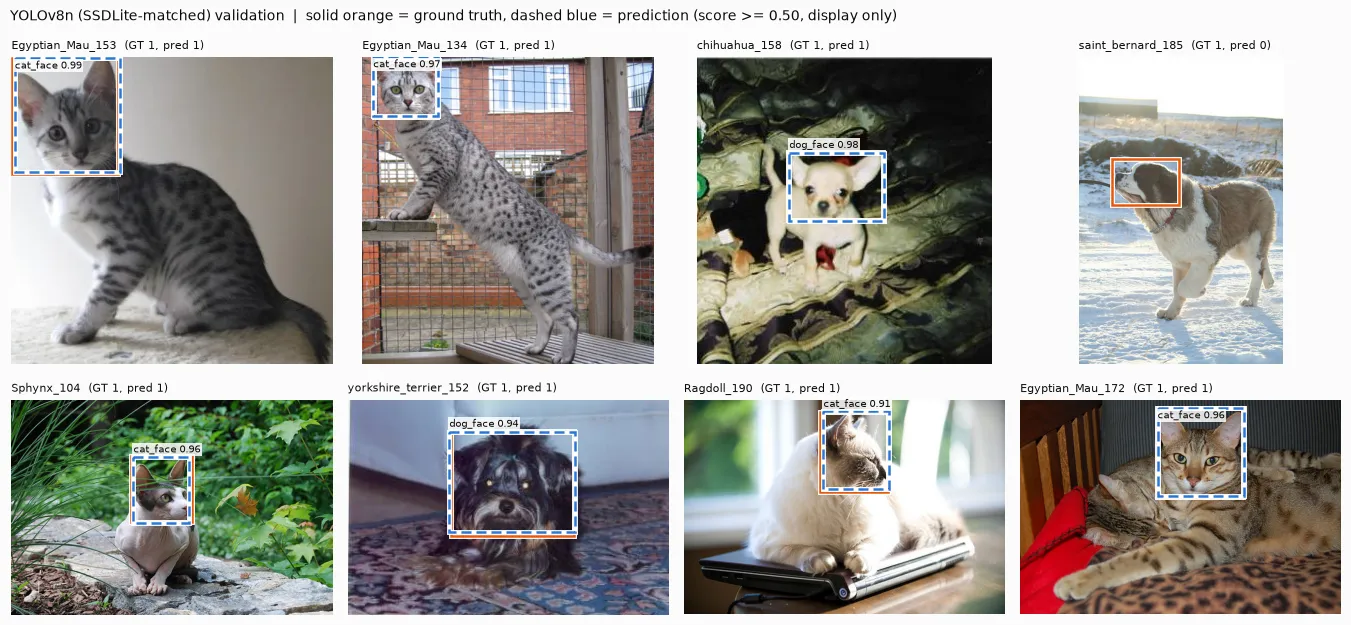
YOLOv8n (공통 조건). 같은 8장이다.
대부분의 이미지에서 YOLOv8n의 점선이 정답 실선에 더 가깝게 붙어 있다. 두 모델 모두 놓친 사례도 하나씩 있다. SSDLite320은 옆을 보는 Ragdoll_190에서 0.5 이상 박스가 없었다. YOLOv8n은 눈밭의 saint_bernard_185에서 0.5 이상 박스가 없었는데, SSDLite320도 이 이미지에서는 정답보다 크게 어긋난 박스(0.63)를 냈다. 8장 표본이고 표시 기준 0.5를 적용한 그림이라, 정량 평가(점수 필터 없음)와는 구분해서 봐야 한다.
추가 확인: YOLOv8n을 3e-4로 해도 결론이 같을까?
공통 조건 YOLOv8n에서 1e-3의 시드 변동(0.8306~0.8451)이 보여, 두 번째 후보였던 3e-4도 시드 1·2를 돌려 봤다.
| YOLOv8n 공통 조건 | 시드별 mAP@0.5:0.95 | 평균 ± 표준편차 |
|---|---|---|
| lr 1e-3 (선정) | 0.8442 / 0.8451 / 0.8306 | 0.8399 ± 0.0081 |
| lr 3e-4 (사후 확인) | 0.8281 / 0.8334 / 0.8328 | 0.8314 ± 0.0029 |
두 학습률의 범위가 겹쳐 우열은 단정하기 어렵다. 그래도 3e-4에서도 SSDLite320보다 0.0701 높아 모델 비교의 방향은 그대로였다. 결과를 본 뒤 YOLOv8n에만 추가 예산을 쓴 확인이므로, 대표 학습률은 사전 규칙대로 1e-3을 유지했다.
최종 평가: holdout과 추론 속도
설정을 모두 고정한 뒤 holdout 550장(고양이 177, 개 373)에 두 모델의 시드 0·1·2 체크포인트 6개를 한 번씩 평가했다. 각 체크포인트는 먼저 저장된 validation 점수를 그대로 재현하는지 확인했고(6개 모두 통과), 그다음에 holdout을 채점했다.
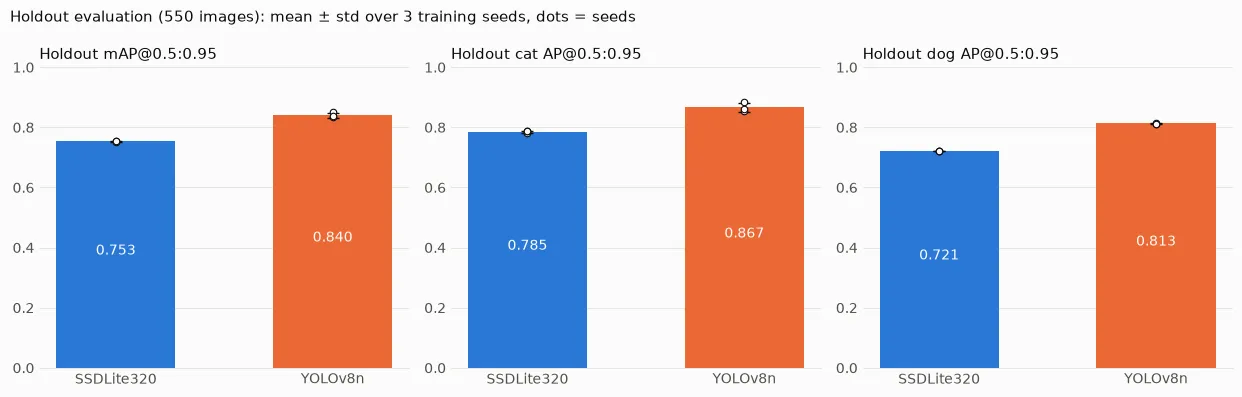
holdout mAP@0.5:0.95, 고양이 AP, 개 AP. 막대는 3시드 평균, 점은 각 시드.
| 모델 | mAP@0.5:0.95 | mAP@0.5 | cat AP | dog AP |
|---|---|---|---|---|
| SSDLite320 | 0.7533 ± 0.0015 | 0.9872 ± 0.0032 | 0.7854 ± 0.0028 | 0.7211 ± 0.0005 |
| YOLOv8n (공통 조건) | 0.8401 ± 0.0082 | 0.9895 ± 0.0056 | 0.8667 ± 0.0142 | 0.8134 ± 0.0022 |
holdout에서도 차이는 +0.0868로 validation과 같은 방향이었다. YOLOv8n의 가장 낮은 시드(0.8341)가 SSDLite320의 가장 높은 시드(0.7544)보다 높다.
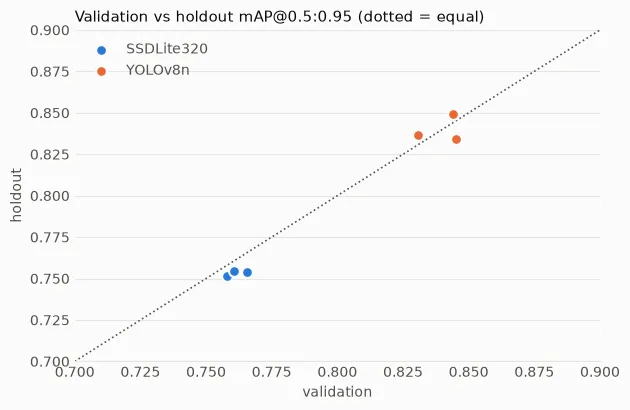
점선은 validation = holdout. 여섯 점이 모두 대각선 근처에 있다. validation에서 holdout으로 옮겼을 때 평균 변화는 SSDLite320 −0.0080, YOLOv8n +0.0001이었다. validation으로 학습률과 epoch를 골랐는데도 holdout 점수가 크게 무너지지 않았다.
속도는 정확도 평가와 분리해서 쟀다.
| 측정 조건 | 값 |
|---|---|
| 범위 | 메모리의 RGB 이미지 1장 → 레터박스 → 장치 전송 → 추론 → NMS → 원본 좌표 복원 (파일 읽기·모델 로딩 제외) |
| 설정 | 배치 1, float32, holdout 200장, 워밍업 20장, 모델당 3회 반복(모델 순서 교차) |
| 후처리 | 점수 0.001, NMS IoU 0.55, 최대 300개 |
| 환경 | Apple Silicon Mac (MPS, CPU 12스레드) |
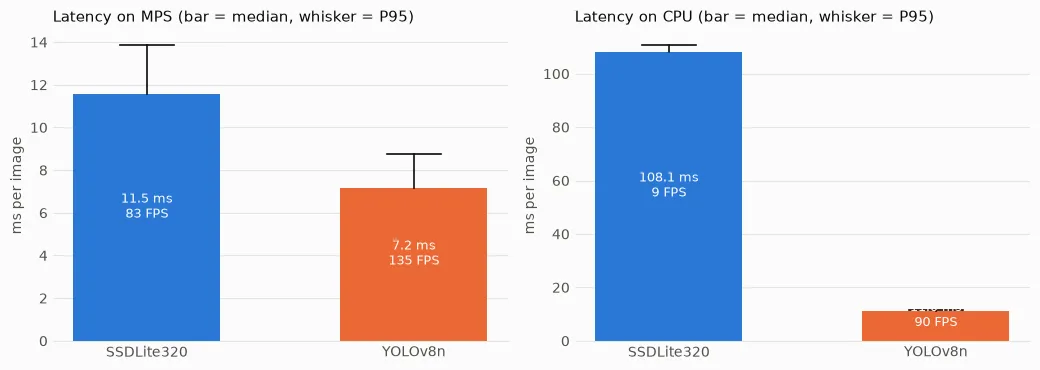
막대는 중앙값, 수염은 P95.
| 장치 | 모델 | 중앙값 (ms) | P95 (ms) | FPS |
|---|---|---|---|---|
| MPS | SSDLite320 | 11.5 | 13.9 | 83.1 |
| MPS | YOLOv8n | 7.2 | 8.8 | 134.7 |
| CPU | SSDLite320 | 108.1 | 110.8 | 9.2 |
| CPU | YOLOv8n | 11.0 | 11.5 | 90.3 |
파라미터는 SSDLite320(2.22M)이 YOLOv8n(3.01M)보다 적지만, 추론은 YOLOv8n이 MPS에서 약 1.6배, CPU에서 약 10배 빨랐다. 파라미터 수만으로 속도를 짐작하면 안 된다는 점을 확인했다.
결론
선정 규칙은 실험 전에 정해 두었다. “validation mAP@0.5:0.95가 최고 모델 대비 1%p 이내인 후보 중 가장 빠른 모델” 이다.
- SSDLite320은 YOLOv8n보다 validation에서 7.86%p 낮아 1%p 이내 후보가 아니다. holdout에서도 같은 방향이었다.
- 속도까지 YOLOv8n이 빨라, 정확도와 속도의 트레이드오프 자체가 없었다.
- 최종 모델은 YOLOv8n (공통 조건, 학습률 1e-3) 으로 정했고, holdout 결과를 본 뒤 설정은 바꾸지 않았다.
돌아보면 결정적이었던 판단은 두 가지다.
- YOLO 기본 방식 결과를 그대로 쓰지 않은 것. 0.8511이라는 더 좋은 숫자가 있었지만, optimizer·EMA·후처리가 다른 상태로는 모델 비교라고 말할 수 없었다. 조건을 맞추자 격차가 줄었고(0.8511 → 0.8399), 줄어든 뒤에도 남은 차이가 모델 사이의 차이에 더 가깝다.
- mAP@0.5와 mAP@0.5:0.95를 나란히 본 것. mAP@0.5만 봤다면 두 모델이 비슷하다고 결론 냈을 것이다. 차이는 박스를 얼마나 정밀하게 맞추느냐에 있었다.
한계와 다음 단계
- 완전히 같은 조건은 아니다. 손실 함수, 모델 구조, 새로 초기화되는 범위는 맞출 수 없었다. SGD 1e-3~1e-4는 SSDLite320 기준 범위라 YOLOv8n의 최선 설정을 찾은 실험도 아니다.
- 학습률 탐색이 범위 끝에 걸렸다. SSDLite320과 공통 조건 YOLOv8n 모두 후보 중 가장 큰 1e-3이 선정됐다. 더 큰 학습률이 더 좋을 가능성이 남아 있다.
- 학습률 선택 기회가 비대칭이다. YOLOv8n에만 3e-4 시드 반복을 사후에 추가했다.
- 시드 3개, 분할 시드 1개(42) 뿐이다. 근접 중복(리사이즈·재압축본)은 확인하지 못했고, holdout은 품종당 13~15장이라 품종별 해석은 어렵다.
- 속도는 이 Mac의 참고값이다. 원래 계획한 Colab GPU나 실제 배포 환경과 다를 수 있다.
- 이미지별 실패 사례와 메모리 사용량은 분석하지 않았다. 두 모델의 차이가 높은 IoU에서 났으므로, 다음 단계는 박스가 어긋나는 사례를 모아 오차를 위치와 크기로 나눠 보는 것이다. 모든 실행에서 개 AP가 고양이 AP보다 낮았던 이유도 아직 확인하지 못했다.
On the same Oxford-IIIT Pet face-box data, which model finds faces more accurately and faster: SSDLite320 or YOLOv8n?
This is not a classification problem of guessing 37 breeds. It is an object detection problem: find where the animal’s face (head ROI) is in the photo, with two classes, cat_face and dog_face. While comparing two lightweight detectors, I kept asking “am I really comparing them under the same conditions?”, and along the way I redesigned the comparison once.
TL;DR
- YOLOv8n, with its training conditions (optimizer, learning-rate candidates, EMA, post-processing) matched to SSDLite320, was more accurate: holdout mAP@0.5:0.95 0.7533 → 0.8401 (mean of 3 seeds).
- mAP@0.5 was similar for both models, around 0.99. The gap came from box precision at high IoU thresholds.
- YOLOv8n was also faster at inference. Median on this Mac: MPS 11.5 → 7.2 ms, CPU 108.1 → 11.0 ms.
Dataset
| Item | Details |
|---|---|
| Source | Oxford-IIIT Pet Dataset (Parkhi et al., CVPR 2012) |
| Images | 7,390 (12 cat breeds, 25 dog breeds, 37 breeds total) |
| Labels | 3,686 face-box files in PASCAL VOC XML format |
| Classes | 0 = cat_face, 1 = dog_face |
| Official split | trainval 3,680 images, test 3,669 images |
12 random images from train/validation. Orange boxes are the XML ground truth. Face size, position, and background vary a lot.
Here the first problem shows up: the official test set has no face XML at all. So AP cannot be computed on test, and I had to re-split the labeled trainval into train/validation/holdout.
Checking the data: what can be trusted before training
README vs. actual files
Most of the README matched the actual files. But three points could not be taken at face value.
| README says | Actual data | Decision |
|---|---|---|
| BREED ID: cats 1~25, dogs 1~12 | list.txt has cats 1~12, dogs 1~25 | Treated as a README typo; used list.txt values |
list.txt lists all images | 7,349 of the 7,390 images are in list.txt | 41 images outside the list |
| Every image has a head ROI label | Only 3,686 XML files; 0 for official test | test not used for AP evaluation |
File matching and image quality
| Check | Result |
|---|---|
trainval images with both image and XML | 3,671 (9 without XML) |
| Images outside the list | 41 (15 of them have XML) |
| Filename/XML mismatch, parse failures, duplicate IDs across splits, metadata conflicts | 0 for all |
| Decode failures | 0 / 7,390 |
Files with a .jpg extension but a different real format | 10 (6 GIF, 4 PNG) — none have XML |
| Format of the 3,671 training candidates | All RGB JPEG; XML size matches actual size for all |
Width, height, and aspect-ratio distribution of the training candidates. Most cluster around 500×375 (median aspect ratio 1.33), but the short side ranges from 108 to 2,448px and the aspect ratio from 0.52 to 2.56. Because of this tail, I had to check separately how much face shapes change when shrinking to 320×320.
Box coordinates
The 3,686 XML files yielded 3,687 boxes. Malformed coordinates, sizes of 0 or less, out-of-image coordinates, unknown classes, and conflicts with official species info were all 0. The only image with two boxes is Bengal_105 (two cats), so the dataset and evaluator were built to accept multiple boxes per image.
The coordinate minimum was 1, not 0, and some boxes had xmax equal to the image width. I read these as PASCAL VOC-style “1-based, endpoint-inclusive” coordinates and converted them to continuous xmin-1, ymin-1, xmax, ymax coordinates for the models.
Passing the coordinate rules does not mean a box actually covers the face, so I checked that separately. I looked at 34 distinct images by eye: 12 random ones, the 8 smallest and 8 largest boxes by relative area, 6 aspect-ratio extremes, and the two-box image.
The 8 boxes with the smallest relative area (0.4–1.0% of the image). Even the small boxes pointed precisely at the faces of distant animals. Among the aspect-ratio extremes, only beagle_181 had a box extending into part of the body, but I did not fix labels based on a single case.
Duplicate images and the split
I used MD5 hashes to find byte-identical files. Of 7,390 images there were 7,360 unique hashes, with 29 groups (59 images) sharing a hash.
- Groups containing 2+ candidates: 0
- Groups shared by a candidate and an official test image: 0
- 30 of the 41 out-of-list images were copies of in-list images.
So I excluded the 41 out-of-list images from the split. They have no official species/breed info, and if copies cross split boundaries, evaluation can come out optimistic.
I split the remaining 3,671 candidates 70:15:15, stratified by breed (split seed 42).
| Split | Images | Boxes | Cat ratio | Purpose |
|---|---|---|---|---|
| train | 2,567 | 2,568 | 0.321 | Training |
| validation | 554 | 554 | 0.323 | Learning rate, best epoch, model selection |
| holdout | 550 | 550 | 0.322 | One final evaluation after settings are fixed |
There were 0 shared image_ids and MD5s across splits. The holdout was never used for later preprocessing decisions, visual box checks, or tuning.
Preprocessing: letterbox or just stretch?
Both models needed a common 320×320 input. There were two options.
| Method | Median box short side | Short side < 16px | Face shape |
|---|---|---|---|
| Letterbox (keep ratio + padding) | 99.8px | 0% | Preserved, but on average 26.4% of the canvas is padding |
| Direct resize (stretch) | 108.2px | 0% | Distorted by the image aspect ratio (0.67–1.51 in the 5–95% range, up to 2.56) |
The difference in face size was small. So I chose the option that preserves face shape: letterbox.
Left column: letterbox only. Right three columns: examples with augmentation added. Even images with an aspect ratio of 2.56 (middle row) or 0.53 (bottom row) keep their faces undistorted; only the padding grows.
| Augmentation (train only) | Value |
|---|---|
| Horizontal flip | p = 0.5 |
| Brightness, contrast, saturation | ±0.3 |
| Hue | ±0.02 |
| Padding color | 114 (augmentation applied before letterboxing so the padding color stays fixed) |
| Excluded | Zoom, shift, crop, YOLO Mosaic |
By leaving out augmentations that only one model is used to, like Mosaic, both models saw the same inputs.
Before training: verify the evaluator and the training path
The built-in evaluation functions of the two models define things slightly differently. So I built a shared evaluator and scored both models with it.
| Evaluation setting | Value |
|---|---|
| Primary metric | mAP@0.5:0.95 (secondary: mAP@0.5, per-class AP) |
| IoU thresholds | 10 thresholds, 0.50–0.95 in steps of 0.05 |
| Precision interpolation | COCO-style 101 points |
| Max detections | 100 per image per class |
| Score filter | None (for quantitative evaluation) |
The evaluator passed 30 checks, including hand-computable cases (perfect predictions, no predictions, IoU 0.667, wrong class, duplicate predictions, etc.). Cross-checked against pycocotools in a separate environment on 4 random scenarios, the mAP difference was at most 6e-17.
Before real training, I trained repeatedly on just 16 training images without augmentation to see whether the model could memorize them.
SSDLite320 overfitting check. Over 60 epochs the loss dropped from 7.95 to 3.54, and mAP@0.5:0.95 on the same 16 images rose from 0.023 to 0.759. This is not evidence of generalization; it is only evidence that loading → coordinate conversion → loss → prediction → coordinate restoration → evaluation is connected end to end. YOLOv8n went from 0.176 to 1.000 on the same check.
I also verified early stopping with best-epoch restoration, stopping on NaN loss, and that interrupting and resuming training gives the same result, before starting the main training.
Experiment design: fix the budget before seeing results
Both models followed the same rules.
| Item | Value |
|---|---|
| Pretraining | COCO (only the classification head re-initialized for 2 classes) |
| Batch / max epochs | 16 / 30 |
| Early stopping | Stop if validation mAP@0.5:0.95 does not improve for 5 epochs |
| LR schedule | Linear warmup for 100 steps, then cosine decay |
| Experiment budget | 3 learning-rate candidates × seed 0 → seeds 1 and 2 added for the chosen rate (5 runs per model) |
| Selection criterion | Best-epoch validation mAP@0.5:0.95 |
I fixed the budget in advance so I would not add candidates after seeing results. Final numbers are reported as mean ± sample standard deviation over 3 seeds, not the single best seed.
Experiment 1: SSDLite320
Using SGD (momentum 0.9, weight decay 4e-5), I searched learning rates 1e-3, 3e-4, and 1e-4.
Partway through, I added a reproducibility guard that puts data, split, and annotation hashes into the run ID. SSDLite320 results run before that are kept as preliminary records; the numbers below are from retraining with the fixed code.
Left: validation mAP@0.5:0.95. Right: training loss (comparable across learning rates since it is the same model). The lower the learning rate, the higher the loss where it stopped. Within the 30-epoch budget, these look undertrained.
| Learning rate | Best / stop epoch | mAP@0.5:0.95 | mAP@0.5 | Final training loss |
|---|---|---|---|---|
| 1e-3 | 13 / 18 | 0.7580 | 0.9757 | 0.92 |
| 3e-4 | 22 / 27 | 0.7293 | 0.9644 | 1.72 |
| 1e-4 | 21 / 26 | 0.6420 | 0.9078 | 3.07 |
I picked 1e-3 and added seeds 1 and 2; all three seeds stopped early.
| Seed | 0 | 1 | 2 | Mean ± SD |
|---|---|---|---|---|
| mAP@0.5:0.95 | 0.7580 | 0.7655 | 0.7605 | 0.7613 ± 0.0038 |
Experiment 2: YOLOv8n default recipe — is this a fair comparison?
At first I ran YOLOv8n close to the Ultralytics default training recipe: AdamW, EMA, gradient clipping, NMS IoU 0.7, with learning-rate candidates 2e-3, 8e-4, and 3e-4.
| Learning rate | Best / stop epoch | mAP@0.5:0.95 |
|---|---|---|
| 2e-3 | 30 / 30 | 0.8014 |
| 8e-4 | 30 / 30 | 0.8377 |
| 3e-4 | 25 / 30 | 0.8534 |
Repeating seeds at 3e-4 gave 0.8511 ± 0.0025, nearly 0.09 higher than SSDLite320.
But I could not compare these numbers as they were. The optimizer, EMA, post-processing NMS threshold, and learning-rate range were all different. As it stood, I could not tell whether the gap came from model architecture or from the training recipe.
Experiment 3: YOLOv8n with conditions matched to SSDLite320
So I retrained YOLOv8n with its training recipe matched to SSDLite320 as closely as possible.
| Item | SSDLite320 | YOLOv8n default (reference) | YOLOv8n matched |
|---|---|---|---|
| Optimizer | SGD, momentum 0.9, wd 4e-5 | AdamW, wd 5e-4 | SGD, momentum 0.9, wd 4e-5 |
| LR candidates | 1e-3, 3e-4, 1e-4 | 2e-3, 8e-4, 3e-4 | 1e-3, 3e-4, 1e-4 |
| EMA | No | Yes | No |
| Gradient clipping | No | Norm 10 | No |
| Backprop loss | Per-image mean | Batch sum | Per-image mean |
| Validation NMS IoU | 0.55 | 0.7 | 0.55 |
| Data, augmentation, evaluator, seeds | — | Same | Same |
Loss functions, model architecture, and the re-initialized portion differ by model, so the conditions are not perfectly identical. But every training setting that could be changed was matched.
Learning-rate search for matched YOLOv8n. SSDLite320’s best score spread from 0.64 to 0.76 depending on learning rate, while YOLOv8n’s three rates stayed within 0.827–0.844. Over the same candidate range, it was less sensitive to learning rate.
| Learning rate | Best / stop epoch | mAP@0.5:0.95 | mAP@0.5 |
|---|---|---|---|
| 1e-3 | 20 / 25 | 0.8442 | 0.9916 |
| 3e-4 | 10 / 15 | 0.8281 | 0.9836 |
| 1e-4 | 16 / 21 | 0.8272 | 0.9800 |
| Seed | 0 | 1 | 2 | Mean ± SD |
|---|---|---|---|---|
| mAP@0.5:0.95 | 0.8442 | 0.8451 | 0.8306 | 0.8399 ± 0.0081 |
With matched conditions, YOLOv8n’s score dropped 0.0112 from the default recipe (0.8511). Still, it remained well above SSDLite320. Since optimizer, EMA, and learning-rate range changed together, I did not isolate which of them accounts for the 0.0112.
Validation comparison
Blue: SSDLite320, orange: YOLOv8n (matched), 3 seeds each. After the first few epochs, the two models’ curves never overlap. The gap between models is far larger than the seed-to-seed variation.
| Model | mAP@0.5:0.95 | mAP@0.5 | Train time per epoch (s) | Params (M) |
|---|---|---|---|---|
| SSDLite320 | 0.7613 ± 0.0038 | 0.9760 ± 0.0008 | 34 | 2.22 |
| YOLOv8n (matched) | 0.8399 ± 0.0081 | 0.9890 ± 0.0023 | 24 | 3.01 |
- The mean difference is +0.0786.
- Even YOLOv8n’s lowest seed (0.8306) beats SSDLite320’s highest seed (0.7655).
- Yet mAP@0.5 is similar for both models, 0.97–0.99.
This was the most important clue in the experiment. Both models are nearly saturated at finding roughly where the face is. The gap opens at IoU 0.75 or 0.9, in how tightly the box is drawn. I did not, however, break box error down into position and size.
Per-class AP@0.5:0.95 (3-seed mean ± SD). For both models, cats score higher than dogs: 0.803 vs 0.720 for SSDLite320, 0.885 vs 0.795 for YOLOv8n. The pattern held in every run across learning rates and seeds. I did not experiment on the cause.
Drawing both models’ predictions on the same 8 validation images makes the difference visible (only scores ≥ 0.5 shown, for visualization).
SSDLite320. Solid orange is ground truth; dashed blue is the prediction.
YOLOv8n (matched). The same 8 images.
In most images, YOLOv8n’s dashed box hugs the solid ground-truth box more closely. Each model also has one miss. SSDLite320 had no box ≥ 0.5 on the side-facing Ragdoll_190. YOLOv8n had no box ≥ 0.5 on saint_bernard_185 in the snow, though SSDLite320 also produced a box well off the ground truth (0.63) on that image. This is an 8-image sample drawn with a 0.5 display threshold, so it should be kept separate from the quantitative evaluation (no score filter).
Extra check: does the conclusion hold with YOLOv8n at 3e-4?
Since matched YOLOv8n at 1e-3 showed seed variation (0.8306–0.8451), I also ran seeds 1 and 2 for the runner-up candidate, 3e-4.
| YOLOv8n matched | mAP@0.5:0.95 per seed | Mean ± SD |
|---|---|---|
| lr 1e-3 (selected) | 0.8442 / 0.8451 / 0.8306 | 0.8399 ± 0.0081 |
| lr 3e-4 (post-hoc check) | 0.8281 / 0.8334 / 0.8328 | 0.8314 ± 0.0029 |
The two learning rates’ ranges overlap, so neither can be declared better. Still, even at 3e-4 YOLOv8n was 0.0701 above SSDLite320, so the direction of the model comparison held. Because this check spent extra budget on YOLOv8n only, after seeing results, I kept 1e-3 as the representative learning rate per the pre-set rule.
Final evaluation: holdout and inference speed
With all settings fixed, I evaluated each model’s seed 0, 1, and 2 checkpoints (6 in total) once on the 550 holdout images (177 cats, 373 dogs). Each checkpoint was first checked to reproduce its saved validation score exactly (all 6 passed), and only then scored on holdout.
Holdout mAP@0.5:0.95, cat AP, dog AP. Bars are 3-seed means; dots are individual seeds.
| Model | mAP@0.5:0.95 | mAP@0.5 | cat AP | dog AP |
|---|---|---|---|---|
| SSDLite320 | 0.7533 ± 0.0015 | 0.9872 ± 0.0032 | 0.7854 ± 0.0028 | 0.7211 ± 0.0005 |
| YOLOv8n (matched) | 0.8401 ± 0.0082 | 0.9895 ± 0.0056 | 0.8667 ± 0.0142 | 0.8134 ± 0.0022 |
On holdout the gap was +0.0868, in the same direction as validation. YOLOv8n’s lowest seed (0.8341) beats SSDLite320’s highest seed (0.7544).
The dashed line is validation = holdout. All six points sit near the diagonal. Moving from validation to holdout, the mean change was −0.0080 for SSDLite320 and +0.0001 for YOLOv8n. Even though learning rate and epoch were chosen on validation, holdout scores did not collapse.
Speed was measured separately from accuracy.
| Measurement setup | Value |
|---|---|
| Scope | One in-memory RGB image → letterbox → device transfer → inference → NMS → restore original coordinates (excludes file reading and model loading) |
| Settings | Batch 1, float32, 200 holdout images, 20 warmup images, 3 repeats per model (model order interleaved) |
| Post-processing | Score 0.001, NMS IoU 0.55, max 300 |
| Environment | Apple Silicon Mac (MPS, CPU 12 threads) |
Bars are medians; whiskers are P95.
| Device | Model | Median (ms) | P95 (ms) | FPS |
|---|---|---|---|---|
| MPS | SSDLite320 | 11.5 | 13.9 | 83.1 |
| MPS | YOLOv8n | 7.2 | 8.8 | 134.7 |
| CPU | SSDLite320 | 108.1 | 110.8 | 9.2 |
| CPU | YOLOv8n | 11.0 | 11.5 | 90.3 |
SSDLite320 (2.22M) has fewer parameters than YOLOv8n (3.01M), yet YOLOv8n was about 1.6× faster on MPS and about 10× faster on CPU. This confirmed that parameter count alone is not a good guide to speed.
Conclusion
The selection rule was set before the experiments: “the fastest model among candidates within 1%p of the best model’s validation mAP@0.5:0.95.”
- SSDLite320 is 7.86%p below YOLOv8n on validation, so it is not within 1%p. Holdout pointed the same way.
- YOLOv8n was also faster, so there was no accuracy–speed trade-off at all.
- The final model is YOLOv8n (matched, learning rate 1e-3), and the settings were not changed after seeing the holdout results.
Looking back, two decisions were decisive.
- Not using the YOLO default-recipe result as is. There was a better number, 0.8511, but with a different optimizer, EMA, and post-processing, it could not be called a model comparison. Matching conditions narrowed the gap (0.8511 → 0.8399), and what remains after narrowing is closer to a difference between the models.
- Looking at mAP@0.5 and mAP@0.5:0.95 side by side. Had I looked only at mAP@0.5, I would have concluded the two models were similar. The difference was in how precisely the box fits.
Limitations and next steps
- The conditions are not perfectly identical. Loss functions, model architecture, and the re-initialized portion could not be matched. SGD at 1e-3 to 1e-4 is a range chosen for SSDLite320, so this was not an experiment that found YOLOv8n’s best settings either.
- The learning-rate search hit the edge of its range. For both SSDLite320 and matched YOLOv8n, the largest candidate, 1e-3, was selected. A larger learning rate might do better.
- Learning-rate selection opportunities were asymmetric. Only YOLOv8n got post-hoc seed repeats at 3e-4.
- Only 3 seeds and 1 split seed (42). Near-duplicates (resized or recompressed copies) were not checked, and holdout has only 13–15 images per breed, so per-breed interpretation is hard.
- Speed figures are reference values for this Mac. They may differ from the originally planned Colab GPU or a real deployment environment.
- Per-image failure cases and memory usage were not analyzed. Since the models differed at high IoU, the next step is to collect cases where boxes are off and split the error into position and size. Why dog AP was lower than cat AP in every run is also still unverified.