개·고양이 얼굴 탐지 모델 비교Comparing Cat and Dog Face Detectors
- 역할Role
- 데이터 점검 · 실험 설계 · 모델링 · 평가
한 줄 요약 Oxford-IIIT Pet 얼굴 박스로 경량 탐지 모델 SSDLite320과 YOLOv8n을 비교했다. YOLOv8n 기본 학습 방식의 점수(0.8511)는 optimizer·EMA·후처리가 달라 공정한 비교가 아니었기 때문에, 학습 조건을 맞춰 다시 학습했다. 그래도 YOLOv8n이 holdout mAP@0.5:0.95 0.7533 → 0.8401로 더 정확했고, CPU 추론은 약 10배 빨랐다.
1. 문제: 얼굴은 둘 다 찾는다
사진 속 동물의 얼굴 위치를 cat_face·dog_face 두 클래스로 찾는 객체 탐지 문제다. 데이터는 Oxford-IIIT Pet 7,390장(37품종)이다.
시작부터 걸림돌이 있었다. 공식 test에는 얼굴 정답이 하나도 없었다. 그래서 정답이 있는 trainval 3,671장을 train/validation/holdout(70:15:15)으로 다시 나누고, holdout은 모든 설정을 확정한 뒤 딱 한 번만 쓰기로 했다.
2. 접근: 학습 전에 비교의 바닥부터 다졌다
- 데이터 점검: README와 실제 파일을 대조해 품종 번호 오기, 목록 밖 이미지 41장(그중 30장은 복사본), 확장자만
.jpg인 GIF·PNG 10장을 찾았다. 목록 밖 이미지는 분할 경계를 넘을 수 있어 제외했다. - 같은 입력: 두 모델 모두 320×320 레터박스로 통일하고, YOLO의 Mosaic처럼 한 모델에만 익숙한 증강은 뺐다.
- 같은 채점: 두 모델의 내장 평가 함수 대신 공통 평가기를 만들어, 손 계산 사례 30개와 pycocotools 대조(오차 6e-17 이하)로 검증했다.
- 예산 고정: 학습률 후보 3개 × 시드 1개 → 선정 학습률로 시드 2개 추가. 결과를 본 뒤 후보를 늘리지 않도록 미리 정했다.
3. 실험: 더 좋은 숫자를 의심했다
| 단계 | 한 일 | 결과 (validation mAP@0.5:0.95) |
|---|---|---|
| 실험 1 | SSDLite320, SGD로 학습률 탐색 | 0.7613 ± 0.0038 |
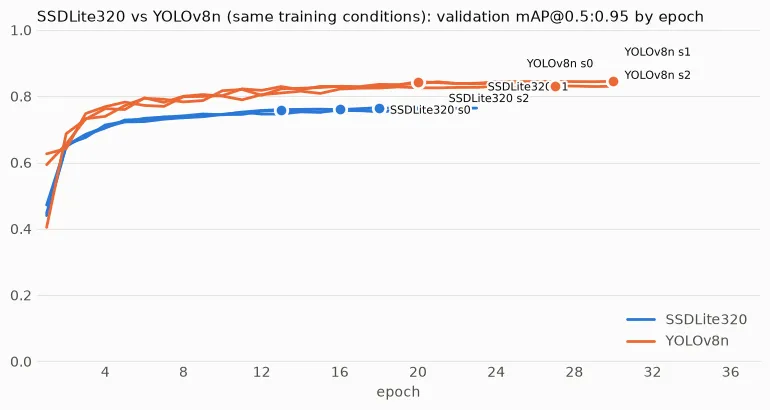
| 실험 2 | YOLOv8n, Ultralytics 기본 방식(AdamW, EMA, NMS 0.7) | 0.8511 ± 0.0025 |
| 실험 3 | YOLOv8n, SSDLite320과 같은 optimizer·학습률 후보·손실 평균·NMS, EMA 없음 | 0.8399 ± 0.0081 |
실험 2의 숫자가 가장 좋았지만 그대로 쓰지 않았다. 학습 방식이 전부 달라서, 차이가 모델에서 왔는지 학습 설정에서 왔는지 구분할 수 없었기 때문이다. 조건을 맞추자 격차는 줄었지만, 남은 차이는 모델 사이의 차이에 더 가깝다.
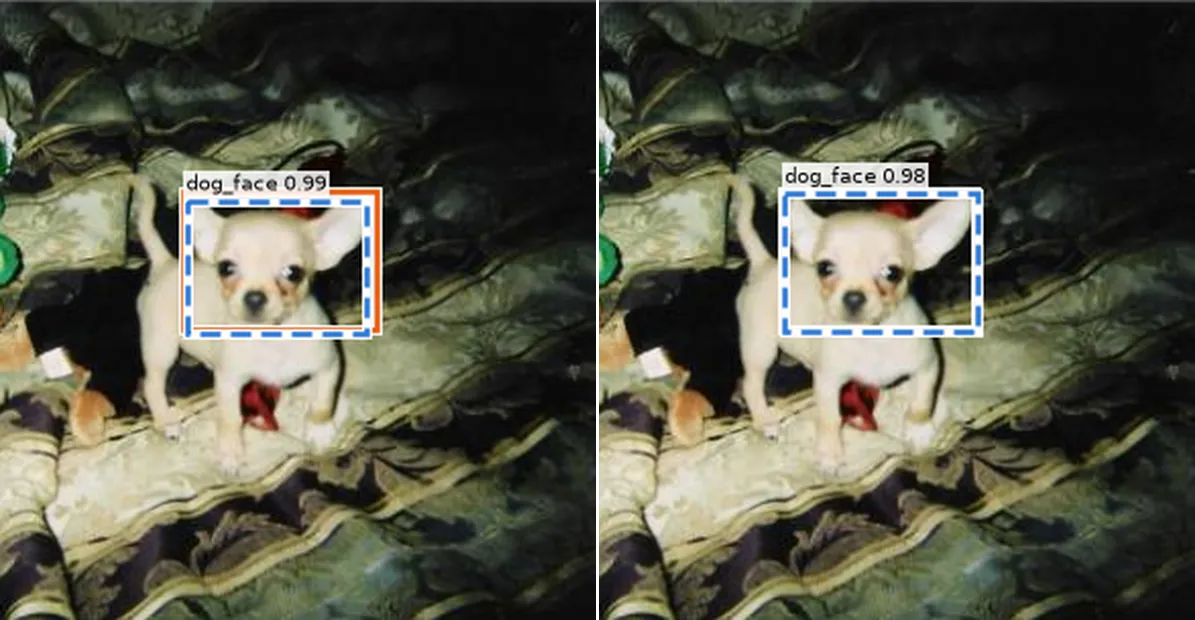
결정적인 단서는 mAP@0.5가 두 모델 모두 0.97~0.99로 비슷하다는 점이었다. 얼굴이 대략 어디 있는지는 둘 다 찾는다. 차이는 IoU 0.75·0.9처럼 박스를 얼마나 딱 맞게 그리느냐에서 벌어졌다. 커버 그림의 왼쪽(SSDLite320)과 오른쪽(YOLOv8n)이 같은 사진에 대한 두 모델의 예측이다.
4. 결과
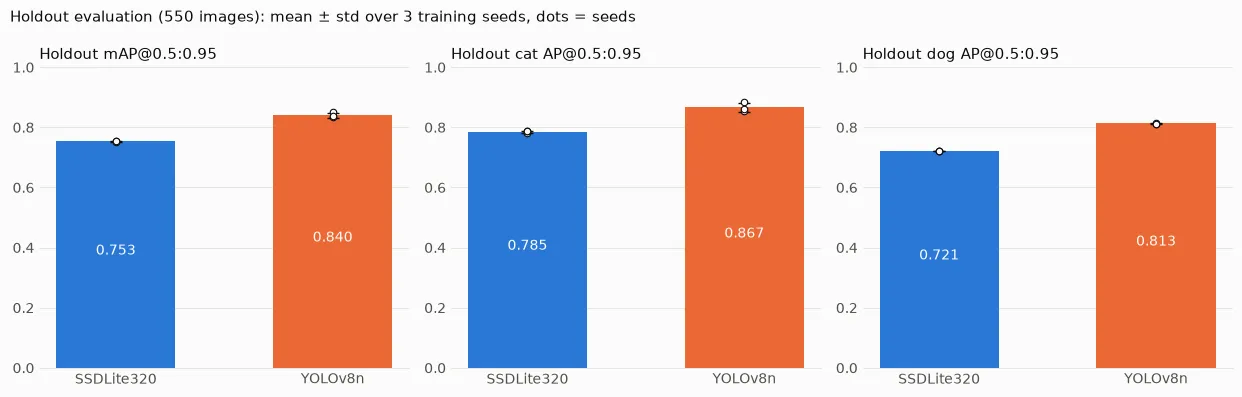
holdout 550장에 두 모델의 시드 3개 체크포인트를 한 번씩 평가했다.
| 모델 | mAP@0.5:0.95 | mAP@0.5 | CPU 추론 (중앙값) | 파라미터 |
|---|---|---|---|---|
| SSDLite320 | 0.7533 ± 0.0015 | 0.9872 | 108.1 ms | 2.22M |
| YOLOv8n (공통 조건) | 0.8401 ± 0.0082 | 0.9895 | 11.0 ms | 3.01M |
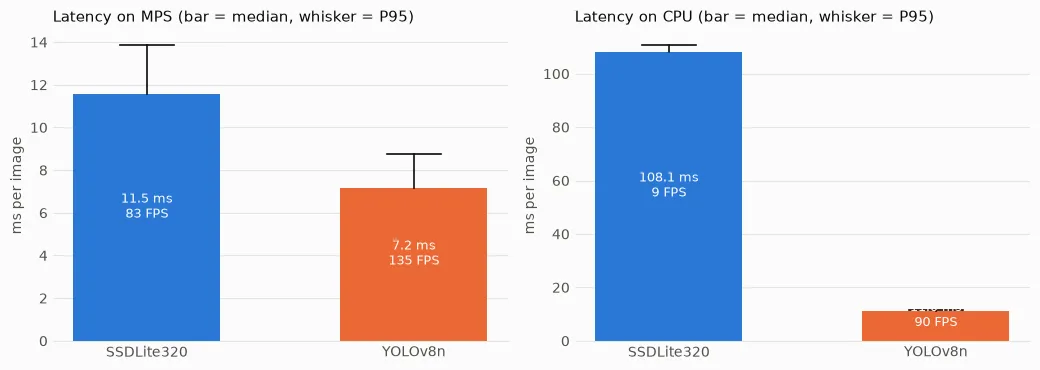
YOLOv8n은 파라미터가 더 많은데도 MPS에서 약 1.6배, CPU에서 약 10배 빨랐다. 정확도와 속도 사이에 트레이드오프가 없어, 미리 정한 선정 규칙대로 YOLOv8n을 골랐다.
5. 배운 점과 한계
- 비교의 공정성은 숫자보다 먼저다. 더 좋은 숫자(0.8511)가 있었지만, 조건이 다른 상태로는 “모델 비교”라고 말할 수 없었다.
- 지표를 하나만 보면 결론이 바뀐다. mAP@0.5만 봤다면 두 모델이 비슷하다고 판단했을 것이다.
- 손실 함수·구조처럼 맞출 수 없는 차이는 남아 있고, 두 모델 모두 학습률 후보 중 가장 큰 값이 선정돼 더 큰 학습률을 확인하지 못했다.
- 시드 3개, 분할 1개뿐이고, 속도는 이 Mac 기준 참고값이다. 다음 단계는 박스가 어긋나는 사례를 모아 오차를 위치와 크기로 나눠 보는 것이다.
데이터 점검, 학습률 탐색, 평가기 검증, 추론 측정 조건까지 담은 전체 실험 기록은 Log 글에 있다.
TL;DR I compared two lightweight detectors, SSDLite320 and YOLOv8n, on Oxford-IIIT Pet face boxes. YOLOv8n’s default-recipe score (0.8511) was not a fair comparison because its optimizer, EMA, and post-processing were different, so I retrained it with matched training conditions. YOLOv8n was still more accurate, with holdout mAP@0.5:0.95 0.7533 → 0.8401, and about 10× faster on CPU.
1. Problem: both models find the face
This is an object detection problem: find where the animal’s face is in the photo, with two classes, cat_face and dog_face. The data is Oxford-IIIT Pet, 7,390 images (37 breeds).
There was a snag from the start: the official test set had no face labels at all. So I re-split the 3,671 labeled trainval images into train/validation/holdout (70:15:15), and decided to use the holdout exactly once, after every setting was fixed.
2. Approach: lay the groundwork for a fair comparison before training
- Data checks: Comparing the README with the actual files turned up a breed-ID typo, 41 images outside the list (30 of them copies), and 10 GIF/PNG files with only a
.jpgextension. I excluded the out-of-list images since they could cross split boundaries. - Same inputs: Both models got 320×320 letterboxed inputs, and I left out augmentations only one model is used to, like YOLO’s Mosaic.
- Same scoring: Instead of each model’s built-in evaluation, I built a shared evaluator and verified it with 30 hand-computed cases and a pycocotools cross-check (difference ≤ 6e-17).
- Fixed budget: 3 learning-rate candidates × 1 seed → 2 more seeds for the chosen rate. Set in advance so I would not add candidates after seeing results.
3. Experiments: doubting the better number
| Step | What I did | Result (validation mAP@0.5:0.95) |
|---|---|---|
| Exp. 1 | SSDLite320, learning-rate search with SGD | 0.7613 ± 0.0038 |
| Exp. 2 | YOLOv8n, Ultralytics default recipe (AdamW, EMA, NMS 0.7) | 0.8511 ± 0.0025 |
| Exp. 3 | YOLOv8n, same optimizer, LR candidates, loss averaging, and NMS as SSDLite320, no EMA | 0.8399 ± 0.0081 |
Experiment 2 had the best number, but I did not use it as is. With every part of the training recipe different, I could not tell whether the gap came from the model or from the training settings. Matching conditions narrowed the gap, and what remains is closer to a difference between the models.
The decisive clue was that mAP@0.5 was similar for both models, 0.97–0.99. Both find roughly where the face is. The gap opened at IoU 0.75 or 0.9, in how tightly the box is drawn. The left (SSDLite320) and right (YOLOv8n) halves of the cover image are the two models’ predictions on the same photo.
4. Results
I evaluated each model’s 3 seed checkpoints once on the 550 holdout images.
| Model | mAP@0.5:0.95 | mAP@0.5 | CPU inference (median) | Params |
|---|---|---|---|---|
| SSDLite320 | 0.7533 ± 0.0015 | 0.9872 | 108.1 ms | 2.22M |
| YOLOv8n (matched) | 0.8401 ± 0.0082 | 0.9895 | 11.0 ms | 3.01M |
Despite having more parameters, YOLOv8n was about 1.6× faster on MPS and about 10× faster on CPU. With no trade-off between accuracy and speed, I picked YOLOv8n per the pre-set selection rule.
5. Lessons and limitations
- Fairness comes before the number. There was a better number (0.8511), but with different conditions it could not be called a “model comparison.”
- Looking at one metric can flip the conclusion. Had I looked only at mAP@0.5, I would have judged the two models similar.
- Differences that cannot be matched, like loss functions and architecture, remain, and for both models the largest learning-rate candidate was selected, so larger rates went untested.
- Only 3 seeds and 1 split, and speed figures are reference values for this Mac. The next step is to collect cases where boxes are off and split the error into position and size.
The full experiment record, including data checks, learning-rate search, evaluator validation, and inference measurement setup, is in the Log post.