축구 중계 화면 Semantic SegmentationSoccer Broadcast Semantic Segmentation
- 역할Role
- 데이터 점검 · 실험 설계 · 모델링 · 평가
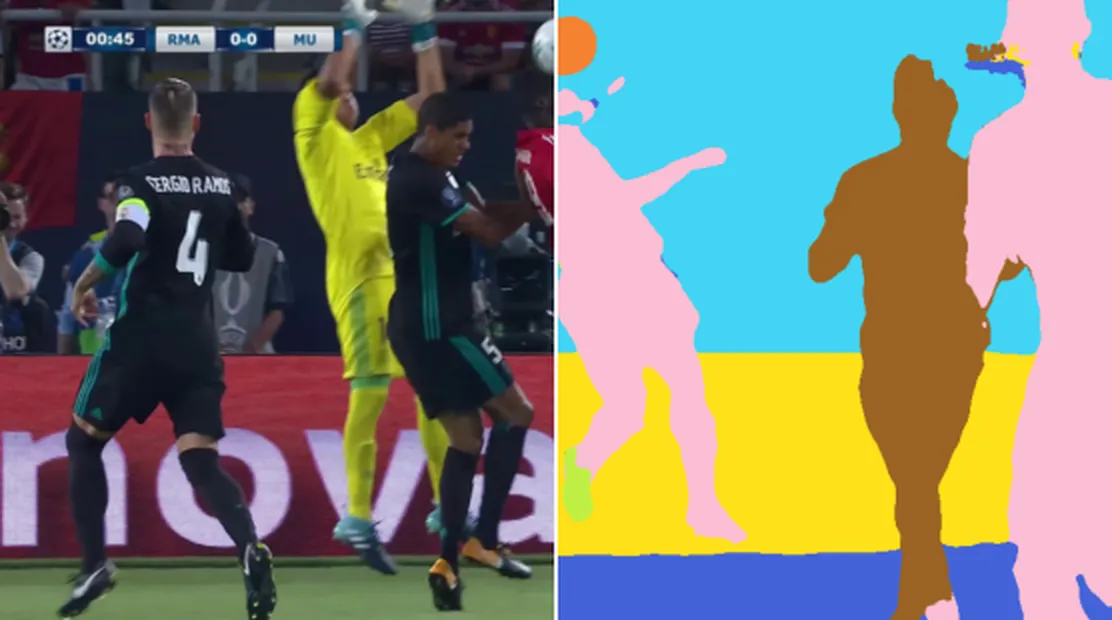
한 줄 요약 축구 중계 화면 100장으로 픽셀 단위 분할 모델을 학습시켰더니, 공·심판·골키퍼처럼 픽셀 1%도 안 되는 클래스가 fold에 따라 IoU 0과 0.8 사이를 오갔다. 시드 실험으로 원인이 데이터 분할이 아니라 학습 불안정임을 확인하고, 손실을 CE + Dice + 클래스 가중치로 바꿔 test mIoU를 0.770 → 0.873, 공 IoU를 0 → 0.771로 올렸다.
1. 문제: 공이 안 잡힌다
데이터는 2017 UEFA 슈퍼컵 하이라이트에서 뽑은 1920×1080 프레임 100장, 10개 클래스(선수 A/B, 골키퍼 A/B, 심판, 공, 골대, 그라운드, 관중, 광고판)다.
데이터셋 문서에 적힌 클래스 비율은 인스턴스 수 기준이었다. 하지만 세그멘테이션 손실은 픽셀 단위로 계산되니 픽셀 면적으로 다시 봤고, 여기서 문제가 드러났다.
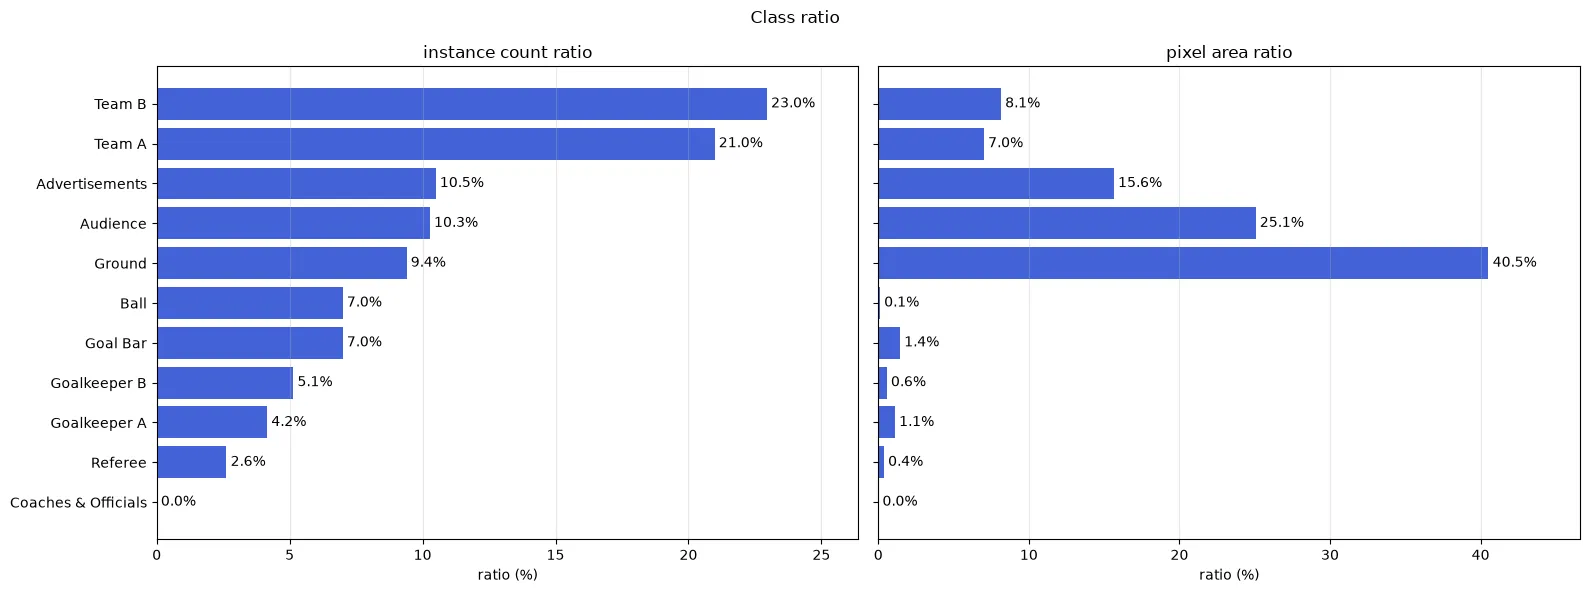
| 클래스 | 인스턴스 비율 | 픽셀 면적 비율 |
|---|---|---|
| Ground | 9.4% | 40.5% |
| Ball | 7.0% | 0.1% |
| Referee | 2.6% | 0.4% |
공은 인스턴스로는 7%지만 픽셀로는 0.1%, 그라운드의 400분의 1이다.
2. 접근: 모델보다 데이터를 먼저 의심했다
학습 전에 점수가 부풀려질 수 있는 지점부터 막았다.
- 완전 중복 이미지(MD5) 1쌍 → 같은 쪽에 묶기
- 유사 이미지(pHash) 32장 / 100장 → 영상에서 뽑은 프레임이라 서로 닮은 장면이 많았다. 전부 train에 고정
- 분할 설계 → 나머지에서 인스턴스 수·픽셀 면적·등장 이미지 수가 모두 7:1.5:1.5에 가깝도록 탐색
3. 실험: 원인을 세 단계로 좁혔다
| 단계 | 한 일 | 알게 된 것 |
|---|---|---|
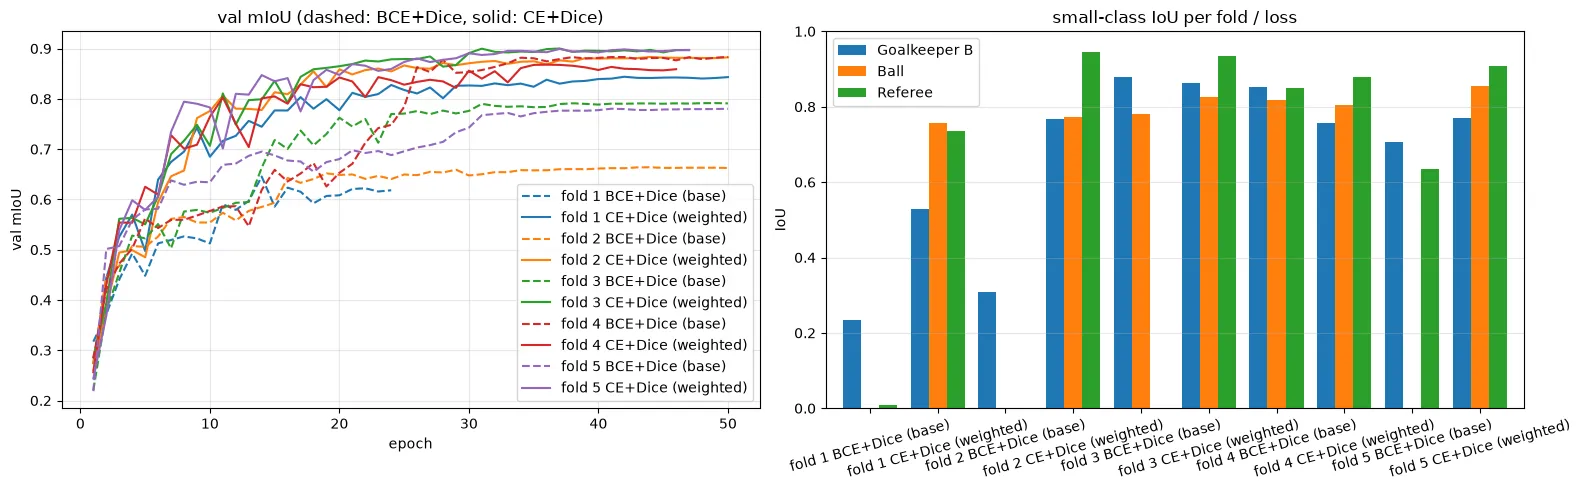
| LAB 1 | U-Net++ (ResNet34) + BCE + Dice, 5-fold 교차검증 | 큰 클래스는 0.9 이상으로 안정적인데, 작은 3개 클래스만 fold마다 IoU 0 ↔ 0.8로 요동. AP는 0.7 이상인데 IoU는 0 |
| LAB 2 | 같은 fold에서 시드만 바꿔 재학습 | 같은 데이터인데 심판 IoU가 0 ~ 0.93으로 갈림 → 원인은 데이터 분할이 아니라 학습 불안정 |
| LAB 3 | BCE → CE, 픽셀 빈도에 반비례하는 클래스 가중치 | 평균 mIoU +0.126, fold 간 표준편차 0.099 → 0.024 |
결정적인 단서는 **“AP는 높은데 IoU는 0”**이라는 패턴이었다. 모델이 공을 아예 모르는 게 아니라, 마지막 argmax 경쟁에서 더 큰 클래스에 밀리고 있었다.
4. 결과
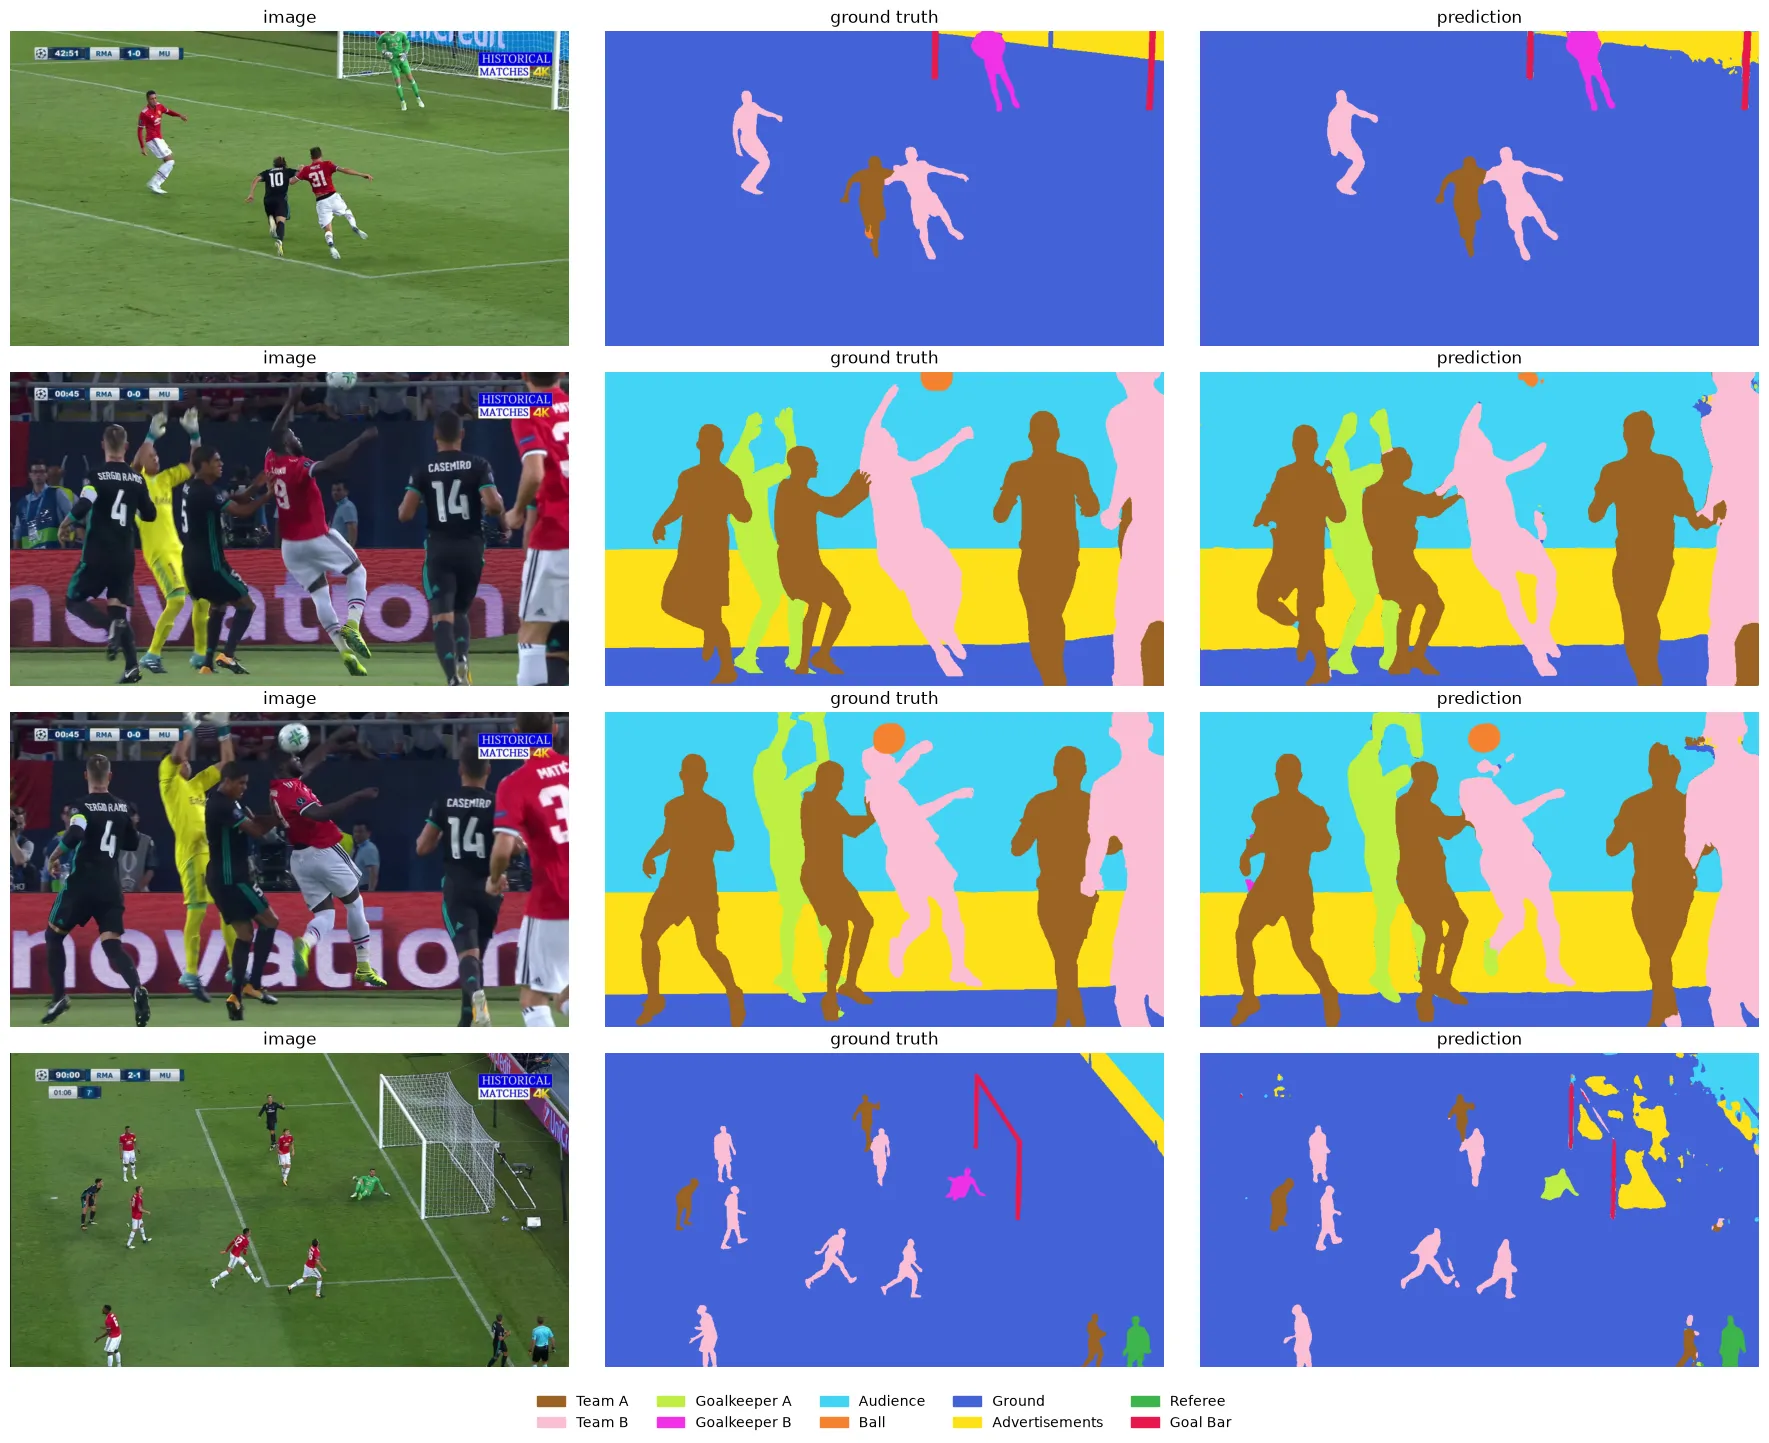
test 15장은 학습과 모델 선택에 한 번도 쓰지 않고 딱 한 번 평가했다.
| 모델 | mIoU | mDice | Ball | Referee | Goalkeeper B |
|---|---|---|---|---|---|
| BCE + Dice | 0.770 | 0.828 | 0.000 | 0.689 | 0.767 |
| CE + Dice + 가중치 | 0.873 | 0.931 | 0.771 | 0.878 | 0.806 |
5. 배운 점과 한계
- 데이터를 볼 때 어떤 단위로 손실이 계산되는지에 맞춰 봐야 한다. 인스턴스 비율만 봤다면 공이 왜 안 잡히는지 한참 헤맸을 것이다.
- 두 가설을 가르는 가장 싼 실험(시드만 바꾸기)을 먼저 했다.
- LAB 3에서 CE 전환과 클래스 가중치를 동시에 바꿔 각각의 기여도는 분리하지 못했다. 다음에 따로 돌려 비교할 예정이다.
- 경계 지표(mBIoU 0.43)는 아직 낮고, 실제 중계 추적에 쓰려면 연속 프레임 안정성과 속도도 확인해야 한다.
데이터 점검 과정, fold별 수치, 놓친 객체 분석까지 담은 전체 실험 기록은 Log 글에 있다.
TL;DR I trained a pixel-level segmentation model on 100 soccer broadcast frames, and classes making up less than 1% of pixels — the ball, the referee, a goalkeeper — swung between IoU 0 and 0.8 depending on the fold. A seed experiment showed the cause was not the data split but unstable training, and switching the loss to CE + Dice + class weights raised test mIoU from 0.770 → 0.873 and ball IoU from 0 → 0.771.
1. Problem: the ball isn’t detected
The data is 100 frames at 1920×1080 taken from 2017 UEFA Super Cup highlights, with 10 classes (team A/B, goalkeeper A/B, referee, ball, goal bar, ground, audience, advertisements).
The class ratios in the dataset documentation were by instance count. But the segmentation loss is computed per pixel, so I looked again by pixel area, and that is where the problem showed up.
| Class | Instance ratio | Pixel area ratio |
|---|---|---|
| Ground | 9.4% | 40.5% |
| Ball | 7.0% | 0.1% |
| Referee | 2.6% | 0.4% |
The ball is 7% by instances but 0.1% by pixels — 1/400 of the ground.
2. Approach: suspect the data before the model
Before training, I closed off the places where scores could get inflated.
- Exact duplicate images (MD5): 1 pair → kept on the same side
- Near-duplicate images (pHash): 32 of 100 → frames extracted from video include many look-alike scenes. All fixed to train
- Split design → from the rest, searched for a split where instance count, pixel area and number of images containing each class were all close to 7:1.5:1.5
3. Experiments: narrowing the cause in three steps
| Step | What I did | What I learned |
|---|---|---|
| LAB 1 | U-Net++ (ResNet34) + BCE + Dice, 5-fold cross-validation | Large classes were stable above 0.9, but only the three small classes swung between IoU 0 and 0.8 per fold. AP above 0.7, yet IoU 0 |
| LAB 2 | Retrained the same fold changing only the seed | With the same data, referee IoU ranged from 0 to 0.93 → the cause was not the data split but unstable training |
| LAB 3 | BCE → CE, plus class weights inversely proportional to pixel frequency | Mean mIoU +0.126, standard deviation across folds 0.099 → 0.024 |
The decisive clue was the pattern “high AP but IoU 0”. The model did know something about the ball; it was losing the final argmax competition to larger classes.
4. Results
The 15 test images were never used for training or model selection and were evaluated exactly once.
| Model | mIoU | mDice | Ball | Referee | Goalkeeper B |
|---|---|---|---|---|---|
| BCE + Dice | 0.770 | 0.828 | 0.000 | 0.689 | 0.767 |
| CE + Dice + weights | 0.873 | 0.931 | 0.771 | 0.878 | 0.806 |
5. Lessons and limitations
- Look at data in the unit the loss is computed in. Had I only looked at instance ratios, I would have spent a long time wondering why the ball wasn’t detected.
- I ran the cheapest experiment that separates the two hypotheses (changing only the seed) first.
- LAB 3 switched to CE and added class weights at the same time, so their individual contributions weren’t separated. I plan to run them separately next.
- The boundary metric (mBIoU 0.43) is still low, and using this for real broadcast tracking would also require checking stability across consecutive frames and speed.
The full experiment record — the data checks, per-fold numbers and analysis of missed objects — is in the Log post.